
The Underlying Human Factors Driving the Proximate Causes
The driving forces of climate change embody a complex, interactive set of actions and rationales that give rise to the proximate causes. In other words, driving forces are the underlying reasons why people engage in various activities. Understanding the driving forces helps to answer questions such as, why do people drive cars to work (a proximate cause of climate change) when they could walk, ride a bike, or take a bus?
There are five driving forces:
- population growth,
- technological development,
- economic growth,
- institutions, and
- attitudes and beliefs.
The five driving forces are represented in the photo, below: population growth is represented by innumerable houses; technological development is represented by a driver of climate mitigation, a wind turbine; economic growth is represented by the explosive economic development of Shanghai, China; attitudes and beliefs are represented by a cultural icon, McDonald’s golden arches, which denotes attitudes and beliefs about food, convenience, and more; and institutions are represented by the Supreme Court building in Washington, DC.

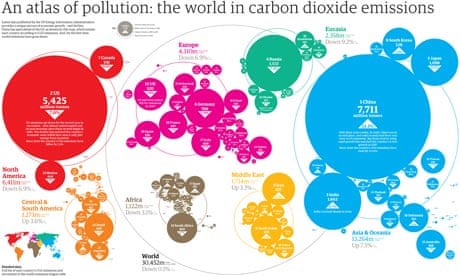
Population growth - No matter whether they represent agrarian, industrial, or high-tech post-industrial societies, growing populations demand more energy, materials, and room. Human population growth has been explosive, going from 1 billion, less than two hundred years ago, to just over 7 billion today. While this rapid population growth, coupled with the other four driving forces, is at the root of climate change, ascribing the 'blame' for climate change to a growing human population is overly simplistic. Certainly, more people place more demands on the planet's resource, but those demands are unevenly distributed. If you look at CO2 emissions per capita, a very different story emerges. My child born into the United States inherently has a larger carbon footprint than one born into virtually anywhere else in the world. If we look at Africa and some parts of Asia where population growth rates are currently highest, we see that their per capita emissions are the lowest (China of course being the very big exception to this rule).
Technological change has also been quick. Looking at energy and attendant technologies, most energy needs were provided by biomass until the Industrial Revolution, but in many regions, fossil fuels replaced biomass in the 19th and 20th centuries, and nuclear and renewable energy emerged in the latter 20th century. Turning to high technology, computers were unknown before the 1950s, but dominated economies, bureaucracies, educational systems, and even social networks by the first decade of the 21st century. Rapid changes in technology, coupled with soaring populations lead to immense demand for energy and materials — all driving climate change. Ironically, one hope for decreasing the human forcing of climate change involves developing and adopting advanced energy and computer-controlled technologies.
This interactive graphic shows adoption rates, measured as the percentage of households in the US using particular technologies. Data is given for the change in use between the years of 1860 and 2019 for technologies such as flush toilets, computers, telephone landlines, automobiles, washing machines, etc. Please see the text above the image.
Economic growth (including “negative growth”) can also be rapid and can have a tremendous influence on climate forcing. The fall of the Soviet Union and its satellites is a good example. The Soviet political system promoted growth-at-any-cost economic policies. The industries of this empire used outdated, dirty fossil fuel-based technologies, resulting in massive greenhouse gas emissions. With the collapse of the Soviet political and economic system in the late 1980s and early 1990s, greenhouse gas emissions from these countries plummeted and global carbon dioxide emissions actually decreased for a short time. Similarly, but in the opposite direction, the recent explosive growth of the Chinese economy, with its 1.3 billion people and heavy reliance on coal, has resulted in soaring global carbon dioxide concentrations—concentrations that exceed the worst-case scenarios envisioned by climate scientists.
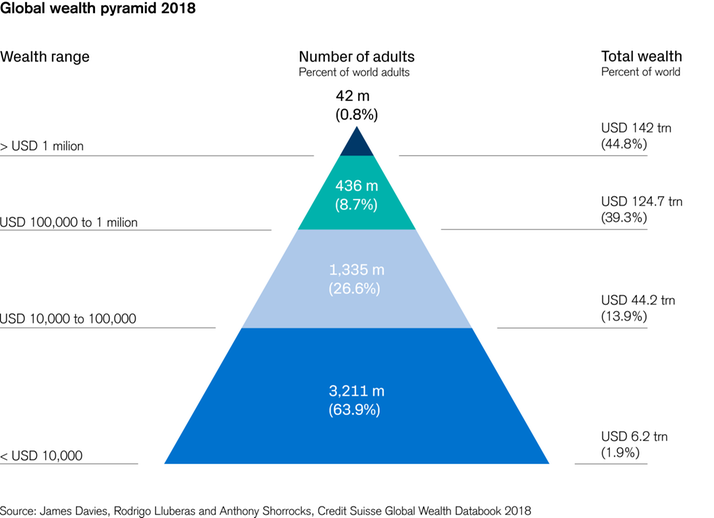
It's important as we are thinking about issues related to equity to take a look at the shape of our global economy. Here, the global wealth pyramid illustrates that just 0.8% of the population holds almost 45% of the world's wealth. This has enormous implications for our responses to climate change, both as individuals and as a society.
Legal, governmental, economic, academic, and other institutions can drive human activities causing climate change. For instance, American institutions tend to promote commuting by car and discourage mass transit. Low taxes on gasoline and cheap or free parking make it less expensive to drive to work than to take mass transit; higher gas taxes and expensive, limited parking would make it more cost effective to take mass transit. Extensive road networks, paid for by taxes, and massive parking lots, paid for by a combination of employers and governments, make it convenient and comfortable to drive. In contrast, walking to and from a distant bus stop and waiting for the bus in foul weather with no shelter makes taking the bus much less convenient and comfortable than driving. Ironically, it would be much cheaper for employers and governments to provide more bus stops with shelters than to build roads and parking lots. Many other institutions encourage Americans to drive to work rather than take mass transit.
Widely shared cultural attitudes and beliefs can also cause humans to engage in activities that contribute to climate change. Americans like the individual freedom provided by owning and driving a car, thus promoting the proliferation of vehicles on the road. Americans also prize comfort, convenience, utility, and feeling in-charge, which causes many of them to prefer large, inefficient sport utility vehicles (SUVs), minivans, and pickup trucks over commuting or small, efficient, and less showy compact and subcompact cars. Coupled with rising population, growing wealth, and support from institutions, characteristic American attitudes and beliefs have driven the explosive growth of the SUV, minivan, and pickup market over the last generation and have led to a surge in greenhouse gas emissions from transportation.