Prioritize...
Upon completion of this section, you should be able to identify the meteorological region referred to as the tropics, be able to give context for its size (in relation to the entire earth), contrast typical temperature and pressure patterns in the tropics with those in the mid-latitudes, and discuss why the tropics are important energetically to the general circulation.
Read...
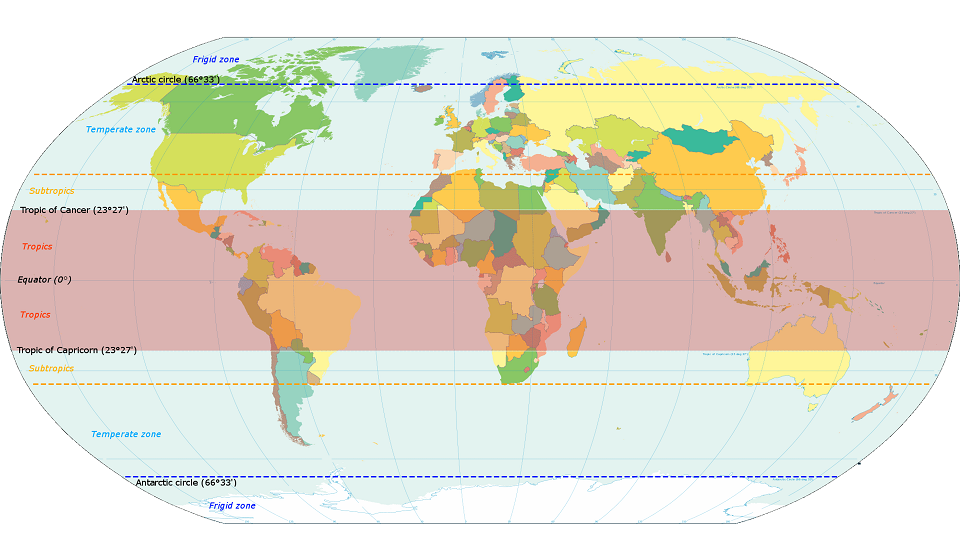
If we're going to study the tropics, we should start by defining exactly what the tropics are, but in reality, folks can't seem to agree on a single definition of the tropics. The definition from the glossary of the American Meteorological Society, for example, is pretty vague! Other definitions are based on geography, and define the tropics as the area between certain latitude lines in each hemisphere.
One common definition is to define the tropics as the area between the Tropic of Cancer (roughly 23.5-degrees North latitude) and the Tropic of Capricorn (roughly 23.5-degrees South latitude), highlighted in crimson in the image below. At some time during the year, the sun is directly overhead each point in this area. But, some definitions actually consider the tropics to cover a larger area, between 30-degrees North latitude and 30-degrees South latitude, given the similar climate characteristics which extend that far from the equator. This area (between 30-degrees North latitude and 30-degrees South latitude) actually accounts for exactly half of the Earth's surface! So, by this definition, the tropics are a pretty big area, and this large low-latitude region will be our focus when we talk about "the tropics."
The fact that the tropics receive more direct sunlight throughout the year than higher latitudes is the root cause of some of the curious characteristics of tropical weather, which make tropical weather quite different from weather in the middle and high latitudes. Consider these contrasts between the tropics and the middle latitudes, for starters:
- Seasonal swings in temperature across the tropics are typically small compared to the large swings that occur in the middle latitudes from summer to winter. In fact, temperature swings during the year in the tropics can be so small that the seasons are determined more by dramatic changes in clouds and rainfall.
- Wind directions in the tropics tend to be much less variable than they are in the middle latitudes (at many tropical locations, a single particular wind direction tends to dominate) because of persistent pressure patterns.
- Tropical cyclones (which we'll cover later) tend to form and thrive over warm, tropical seas with small horizontal temperature gradients. Meanwhile, you've learned that mid-latitude cyclones thrive off of large horizontal temperature gradients.
We'll explore these throughout the coming lessons, but for now, also consider that the intense solar heating over the low latitudes of the tropics throughout the year has consequences for global energy balance, as well. To see what I mean, check out the short video (2:21) below.
Let’s apply the concept of energy budgets to better understand the tropics and how they relate to higher latitudes. This graph is a plot of average absorbed solar and emitted infrared radiation versus latitude, assuming that we treat the earth and atmosphere as one system. The equator is in the middle and the poles are at the sides of the graph. Overall, there’s a net energy gain in the tropics and a net energy loss in the middle and high latitudes. So, let’s see why that’s the case.
The amount of energy per unit area received by the earth depends on the angle at which the sun’s rays strike the earth. Therefore, solar heating is a maximum over the tropics because the intensity of solar radiation is greatest over low latitudes, and over the course of a year, the tropics receive much more incoming radiation than the poles.
On the loss side of the energy ledger, the amount of energy per unit area emitted by the earth depends on surface temperature. The tropics emit a bit more infrared radiation to space because they’re warmer than higher latitudes. But, the amount of infrared radiation emitted in the tropics still pales in comparison to incoming solar radiation.
So, if we construct an energy budget, we’ll see that the tropics are constantly gaining energy because more energy comes in during the course of the year than goes out. Higher latitudes, on the other hand, are constantly losing energy because more energy goes out over the course of the year than comes in.
By itself, this set-up would cause the tropics to get warmer and warmer every year because they always have this surplus of radiation. On the flip side, higher latitudes would get colder and colder every year because they always run a radiation deficit over the course of a year.
But, obviously that doesn’t happen and the reason why is that energy gets transferred throughout the earth system. Energy from the tropics gets transported from low latitudes toward the poles by the atmosphere and ocean to help keep the system balanced, and prevent runaway temperature increases in the tropics and decreases at higher latitudes.
As discussed in the video, the relatively large losses of infrared energy to space over the tropics only partially offset strong solar heating, resulting in a broad surplus of energy that varies little with latitude between 30 degrees North and South latitude. This relatively even distribution of surplus energy across the tropics accounts, in part, for the general lack of moderate to large horizontal temperature gradients in the tropical troposphere.
One other reason for the generally small temperature gradients at low latitudes is that water covers approximately 75 percent of the tropics. That means the uniform surplus of energy in the tropics gets distributed over large expanses of water, thus further limiting opportunities for large temperature gradients to form (cold air traveling over relatively warm ocean waters gets rapidly modified).
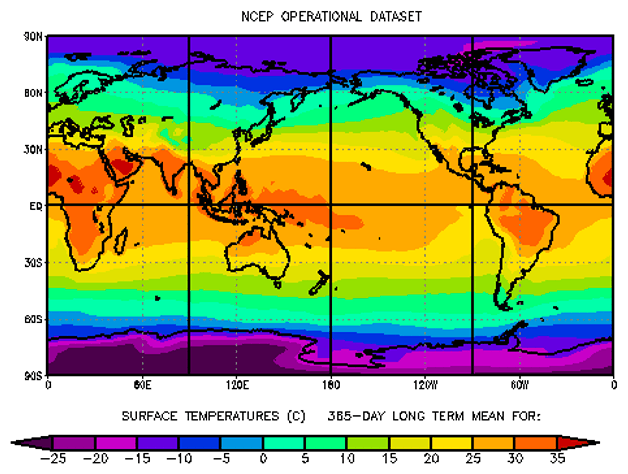
The figure above represents the long-term average of annual surface air temperatures across the globe. I point out that there are indeed temperature gradients between tropical land masses and surrounding oceans, but the overall pattern of temperature gradients in the tropics is weak compared to those at higher latitudes.
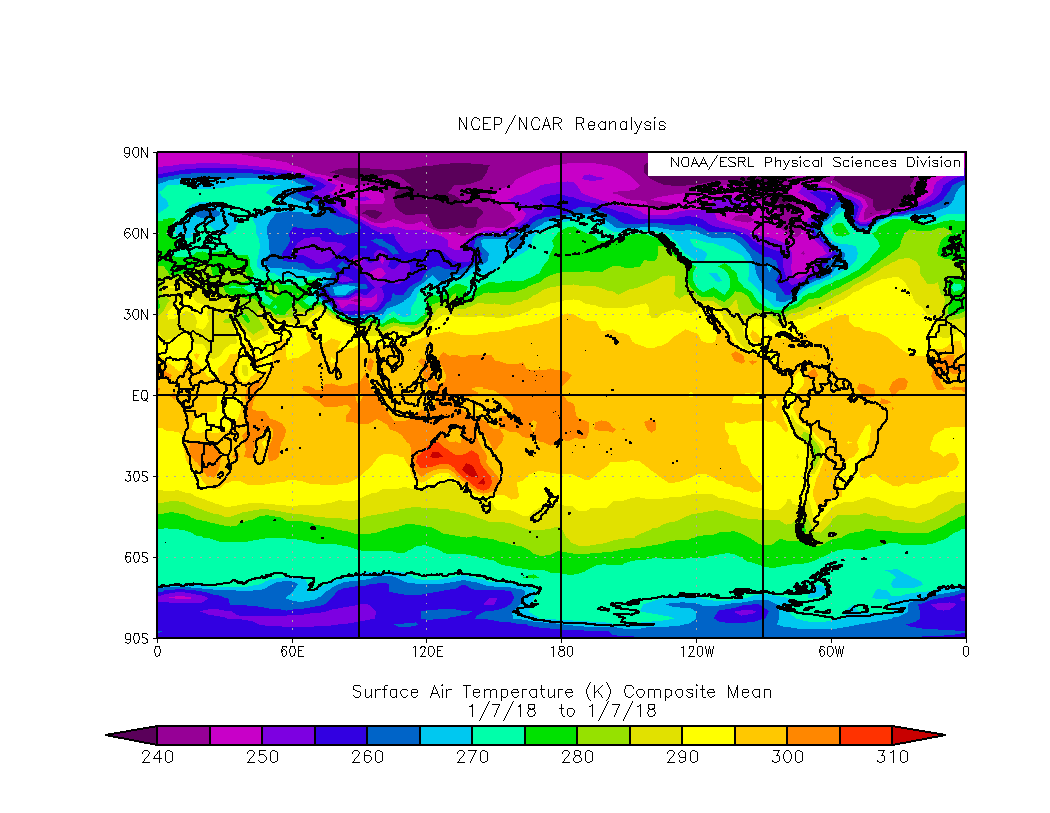
Now, I readily admit that any annual average in temperature tends to "wash out" strong signals of gradients in winter, so perhaps a look at temperatures for a single day would be more telling. Check out daily global surface temperatures for January 7, 2018 (units are Kelvin), when sharp temperature gradients existed over eastern North America, for example, on the fringe of a continental Arctic air mass. Now, compare them to the flabby gradients over the tropics. No contest, wouldn't you agree? Notice that there are some sharper gradients along the outer fringes of the tropics near 30 degrees north. These larger gradients near 30 degrees are not unusual, given that Arctic air masses drive farther south in winter (occasionally into the fringes of the tropics). In the heart of the tropics, however, gradients are small by any standard.
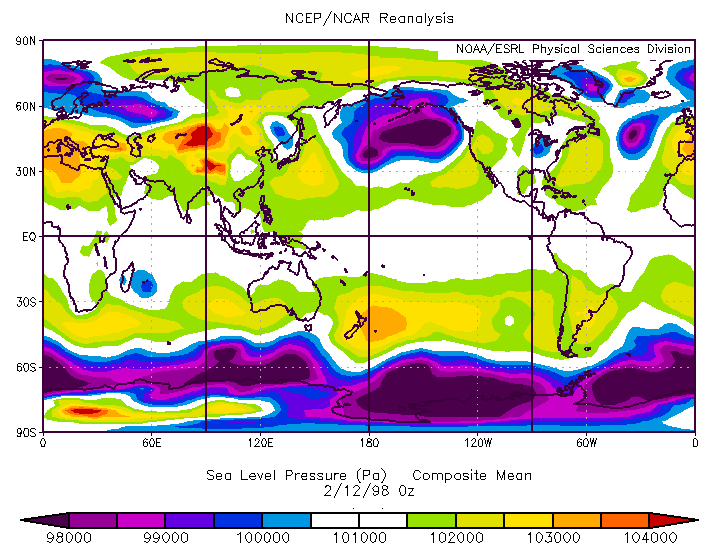
But, it's not just temperature gradients that are small in the tropics. Pressure gradients are small, too (aside from tropical cyclones). For example, check out the chart of average sea-level pressures at 00Z on February 12, 1998 (units are Pascals; 1 Pascal = 100 millibars). At the time, there were intense northern hemispheric low-pressure systems over the Gulf of Alaska, the Great Lakes, the middle Atlantic Ocean, northern Russia and the east coast of Asia (splotches of blues and purples on the map). Meanwhile, robust high-pressure systems (bigger blobs of greens, yellows, oranges and reds) were interspersed between the intense lows. In the tropics, on the other hand, pressure patterns are much more relaxed and much more equable than the middle latitudes. In other words, prominent centers of high and low pressure are more difficult to find, especially equator-ward of latitudes 30 degrees north and south. The one exception was a spot of relatively low pressure (blue splotch) just to the east of Madagascar in the southwest Indian Ocean, which is the signature of Tropical Cyclone Ancelle.
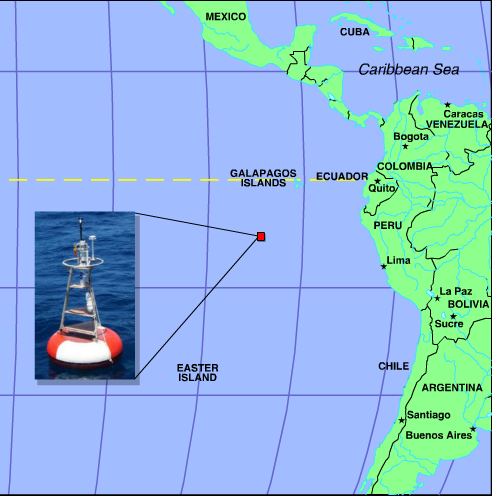
Since the pressure gradient force is a primary driver of wind speed, you might think that the winds are almost always weak in the tropics (outside of tropical cyclones, that is), with the small pressure gradients that exist there. But, that's far from the truth! To help you visualize the fact that many places in the tropics are quite breezy, despite small surface pressure gradients, I'm going to introduce a type of plot called a "wind rose." Wind roses display the observed frequency of wind directions (and sometimes speeds) at a particular location. On the left below is a histogram displaying frequencies of observed wind speeds (in meters per second) at an ocean buoy moored at 8 degrees South, 95 degrees West during the year 2002. On the right is the corresponding wind rose for the buoy, which shows the frequency of observed wind directions during the same year.
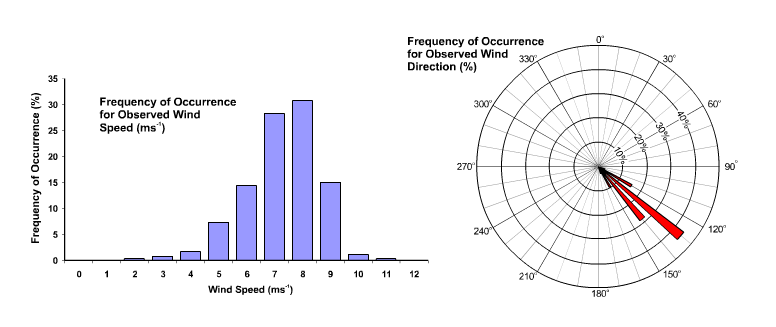
From these two images, we can quickly get two important messages. First, wind speeds at the buoy were between five and nine meters per second (roughly 10 to 20 miles per hour) the vast majority of the time, which hardly constitutes "weak" winds. Second, the direction from which the wind blew during the year was remarkably consistent. To get your bearings with the wind rose, note that each concentric ring represents a ten-percentage point increase in the relative frequency of the observed wind direction. Thus, the daily mean wind direction of 130 degrees (from the southeast) occurred on nearly 45% of the days, and the daily mean wind direction of 140 degrees occurred on about 28% of the days! The wind rose clearly demonstrates that winds retained their overall southeasterly direction for almost the entire year (and didn't deviate much from 130 degrees). Such consistency is in stark contrast to the middle latitudes, where the many high- and low-pressure systems that pass by during the year result in wind directions that are much more variable.
As you'll soon learn, persistent winds from the southeast (in the Southern Hemisphere tropics) and northeast (in the Northern Hemisphere tropics) are the signature of the reliable "trade winds." To start unraveling the mystery of these persistent tropical breezes, we have to start exploring how air circulates through the tropics. Not surprisingly, the direct solar heating in the tropics throughout the year again plays a critical role. Read on.