Prioritize...
On this page, you should focus on the cause of the belt of subtropical highs, and be able to describe their formation, strength, and seasonal changes based on column-weight issues. You should also be able to discuss the dominant vertical motion in the belt of subtropical highs and its implications for local weather and climate.
Read...
As you just learned, high over the Intertropical Convergence Zone (ITCZ), extra-tall cumulonimbus clouds prod and poke the tropopause on a regular basis. To hammer home the connection between the position of the ITCZ and the frequency of thunderstorms, check out this animation representing the average number of daily lightning flashes from January 1 to December 31 (daily averages are based on satellite-based measurements between April, 1995, and November, 2000). Just based on the lightning frequency, you can follow the imprint of the ITCZ as it meanders north and south throughout the year, as well as identify the summer and winter hemispheres even though the individual dates aren't labeled.
Once rising air parcels reach the tropopause, its greater stability acts like a lid to suppress further ascent (remember that the air above the tropopause in the stratosphere is quite stable). So, upon reaching the lid, rising air parcels fan out laterally, heading poleward in both hemispheres and thus becoming part of the upper branches of the Hadley Cells. Parcels head toward the subtropics, where they will eventually sink in concert with the belt of subtropical high-pressure systems that girdles the globe at latitudes in the general vicinity of 30-degrees North and South. These "subtropical" highs form near the fringes of the tropics and are semi-permanent, meaning that they typically appear on long-term-average pressure patterns. To see what I mean, check out the long-term average of sea-level pressures from June through August (top image below) and December through February (bottom image below) to spot the subtropical highs.
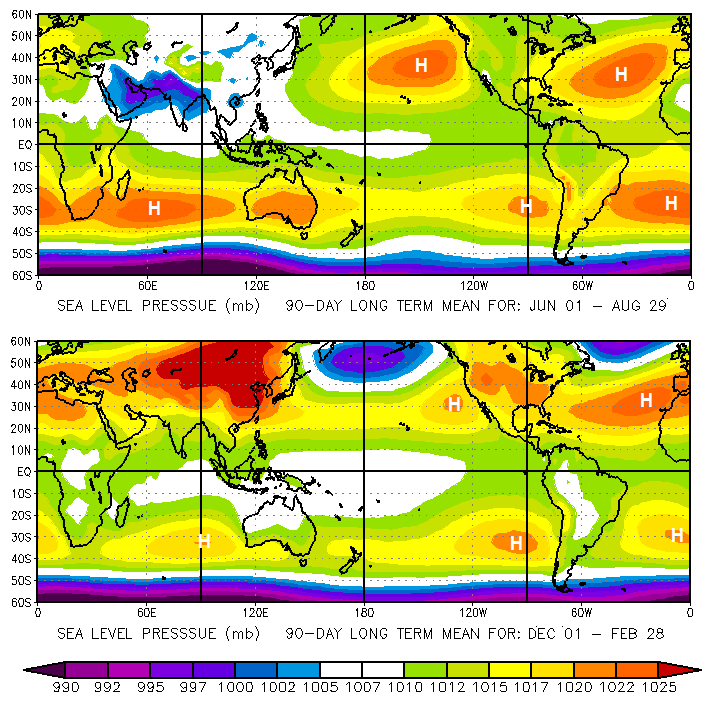
During summer in the Northern Hemisphere (top image above), two dominant subtropical highs emerge -- the Bermuda high over the Atlantic Ocean and the Pacific high. The Bermuda high shares its name with the island of Bermuda because, over the long haul during summer, the average position of this high lies near Bermuda. These two subtropical highs owe their relative strength, in part, to the oceans. During the Northern Hemisphere's summer, the oceans are generally cooler compared to the warmer continents. In turn, cooler, denser maritime air that overlies the oceans serves to boost surface pressures, paving the way for relatively robust subtropical highs during summer.
During the Northern Hemisphere's winter (bottom image above), when the oceans are warmer compared to the continents, the dominant subtropical highs aren't as strong, with the Bermuda high shifting eastward and gradually taking an average position near the Azores Islands. As a result, the Atlantic subtropical high assumes the seasonal name, Azores high.
So, why do these subtropical high-pressure systems exist in the first place? Over the long haul, the clear signal from the recurrent upward motion in the ascending branch of each Hadley Cell is a stream of air flowing poleward at high altitudes. As the air flows poleward it cools. And eventually, in the general neighborhood of 30-degrees latitude, the poleward flow in the upper branch of each Hadley Cell becomes convergent. In turn, this mass convergence of cold air moving in the upper branch of the Hadley Cell adds weight to local air columns near 30-degrees latitude, increasing surface pressure there, and helps to establish the persistent belt of subtropical highs.
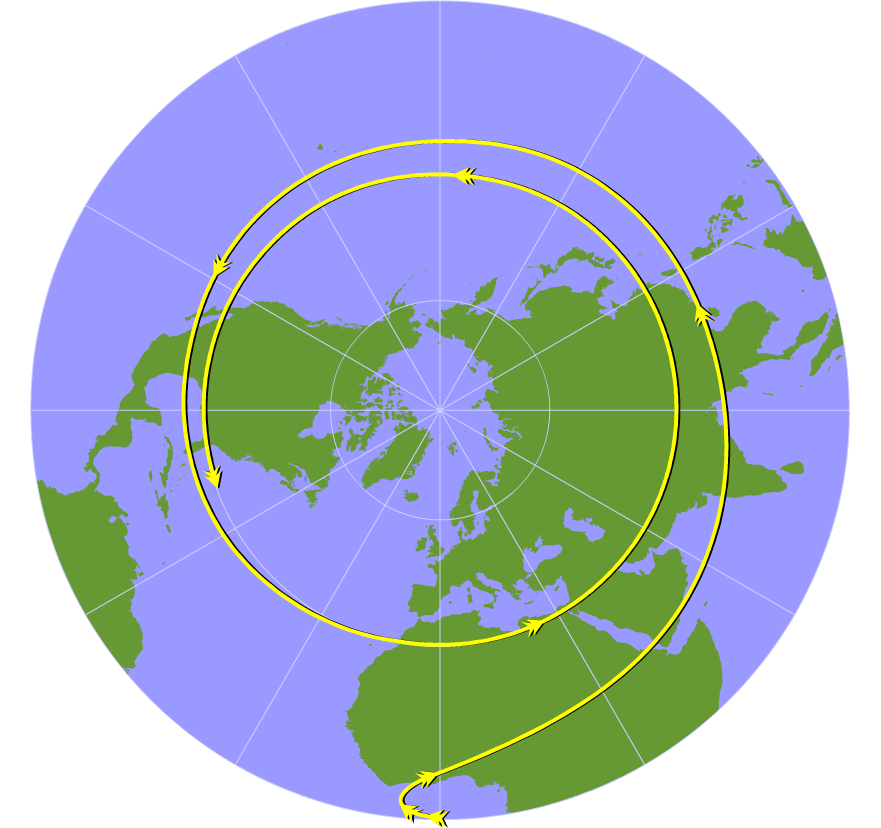
To gain insights into how this high-level convergence occurs, check out the polar stereographic projection of the Northern Hemisphere below. In the image, I highlighted the equator and the latitude circle at 30 degrees for effect. Imagine moving a closed belt of high-altitude air situated over the equator all the way to 30-degrees latitude. There's little doubt that there has to be a "squeeze play." Thus, air must converge as it moves poleward from the equator.

The bottom line is that the mass convergence in the upper branches of the Hadley Cells increases column weight, and thus, surface pressure. It also promotes sinking air, which as you may recall, causes air parcels to warm as they compress because of increasing air pressure at lower altitudes. This sinking (and warming) air in and around the cores of subtropical highs actually works against the increase in column weight caused by upper-level convergence, serving as a "check" on the strength of the subtropical highs. The gently sinking and warming air also leads to increased stability over and east of the centers of the subtropical highs, which stifles the development of showers and thunderstorms.
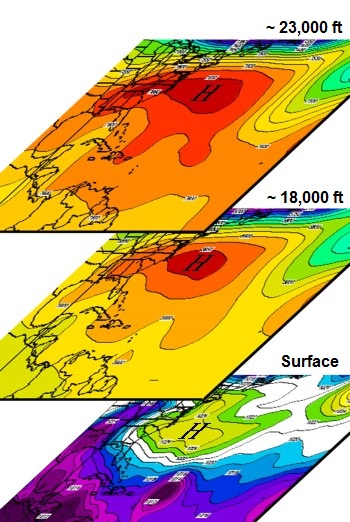
Structurally, subtropical highs aren't merely "surface dwellers." To the contrary, there are reflections of the subtropical highs throughout most of the troposphere. Indeed, check out the spatial relationship between the surface Bermuda high and its reflections higher in the troposphere at 12Z on September 1, 2003. This three-dimensional nature of the subtropical highs means that they influence wind patterns aloft, too, with their broad clockwise flow (in the Northern Hemisphere). Later, you'll learn that winds aloft play a key role in steering tropical cyclones, so it stands to reason that the upper-air reflections of the Bermuda high (and subtropical highs, in general) are important factors in steering tropical cyclones.
Besides acting as a back-seat driver for tropical cyclones, subtropical high-pressure systems provide another piece to the puzzle of weather and climate at low latitudes. Notable contrasts in precipitation exist between the domains of the subtropical highs (in the general neighborhood of 30-degrees latitude) and the wet equatorial zones. If you return to the movie of average monthly precipitation from the last section, the white blobs near 30-degrees latitude mark areas where very little precipitation falls. Clearly, the broad areas of sinking air within the belt of subtropical high-pressure systems take their toll on precipitation, with the associated warming discouraging the development of clouds. As a result, the region of subtropical highs tends to be very dry. For example, the desert landscape of Monument Valley (southeast Utah and northeast Arizona) is a result of an annual average precipitation only around five inches.
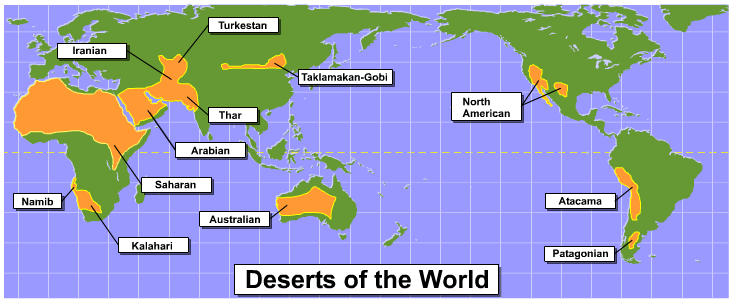
It's pretty much the same story through large swaths of the subtropics in both the Northern and Southern Hemispheres. Indeed, the hot land deserts of the world primarily lie within the persistent belts of sinking air associated with the subtropical high-pressure systems, as shown in the map below. The dearth of water vapor and the lack of vegetation over these deserts all but eliminates clouds to block the sun and evaporational cooling near the ground during the daytime, paving the way for high afternoon temperatures. At night, the dry, frequently cloudless atmosphere readily transmits infrared energy through the atmosphere, allowing for rapid cooling, and setting the stage for diurnal temperature variations of up to 50 degrees Fahrenheit or more!
Finally, I'll remind you that the Hadley circulation is the long-term average weather pattern over the tropics. Indeed, each Hadley cell is not a steadfast circulation that you can readily observe on a daily basis. For example, the Hadley circulation in the Northern Hemisphere's summer gets nearly obliterated by the intense, uneven heating of continents and oceans at low latitudes (the interruption of the Hadley circulation during the Southern Hemisphere's summer is noticeably less pronounced). Despite these summer interruptions, the relatively clear signal from the Hadley circulation becomes, over the long haul, a defining weather pattern at low latitudes.
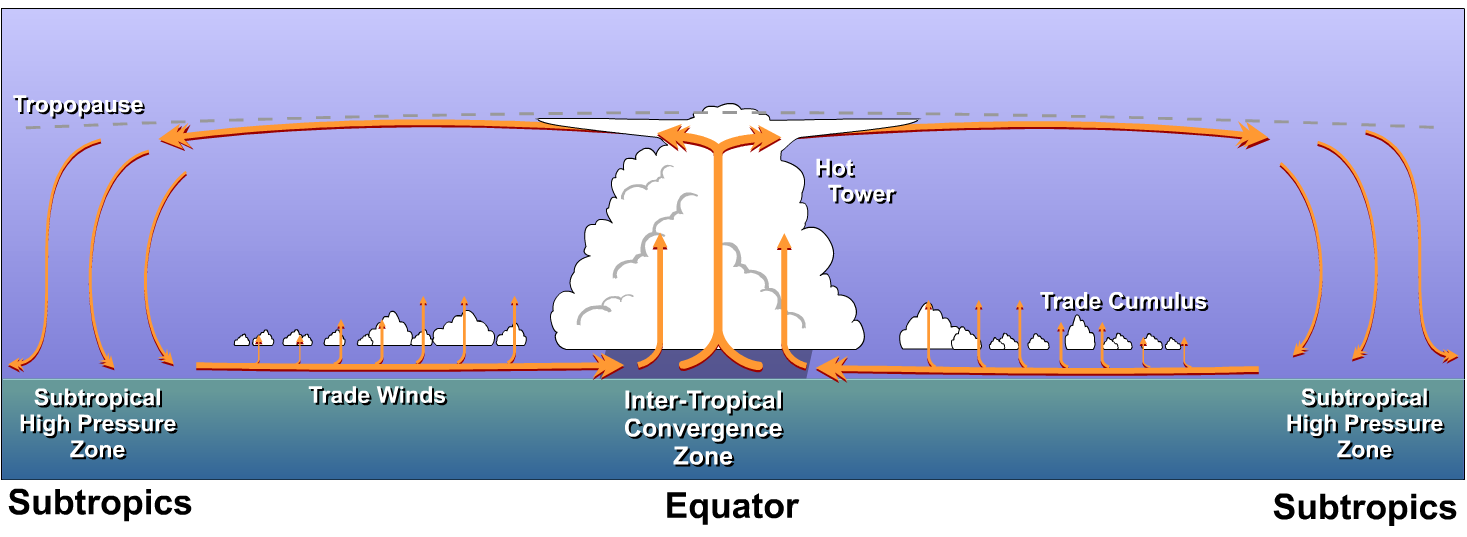
For a complete summary of the Hadley circulation, here is a cross section of the Hadley Cells in both hemispheres, showing the ITCZ and the ascending branches, the poleward flow in the upper branches, sinking air in the subtropics and the corresponding subtropical highs, and, finally, the equator-ward return flow associated with the trade winds. Remember that the circulation is driven by strong solar heating, which ultimately manifests itself in a trough of surface low pressure that marks an elongated area of wind shifts (where the northeasterly trades meet the southeasterly trades). Air rises there in the ITCZ, and upper-level divergence below the tropopause helps keep surface pressures relatively low, helping to maintain the surface trough and the low-level convergence that helps to fuel the ascending branch of the circulation.
So far, we've focused on the ascending branches of the Hadley circulation in the ITCZ and the descending branches that form the subtropical highs. But, we haven't talked much about the upper and lower branches. When I briefly discussed the upper-branch above, I ignored the effects of the earth's rotation on the movement of air to create a simpler picture. But, when the Coriolis force is added to the mix, the upper branches of the Hadley Cells take a much more swirling route. We'll explore the consequences of this swirling route toward the subtropics next. Read on!