Prioritize...
When you're finished with this section, you should be able to discuss seasonal variations in the position of the ITCZ and their consequences for local weather and climate (precipitation, in particular). You should also be able to define thermal equator and doldrums.
Read...
If you're into "oldies" music, you might be familiar with the song "I'll Follow the Sun" by The Beatles. As it turns out, this hit song could be the anthem of the Intertropical Convergence Zone (ITCZ) and the ascending branch of the Hadley Cells. By way of review, the Hadley Cells are closed circulations of air rising over equatorial regions, flowing poleward at high altitudes, and sinking and returning equatorward via the low-level trade winds. The ITCZ marks the region where trade winds from each hemisphere converge. This zone of convergence, as well as the Hadley Cells themselves, are a product of strong solar heating at low latitudes. But, the ITCZ isn't located right at the equator (as you might think). Why is that?
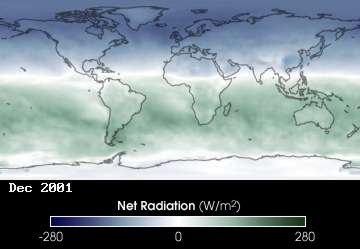
Recall that over the tropics, there's a net gain in energy over the course of a year because incoming solar radiation dwarfs radiation emitted from the tropics. Consider this image created by NASA that shows the net radiation distribution over the earth during December 2001. The green shadings indicate surpluses in radiation, while blues indicate deficits. Clearly, the Southern Hemisphere (where it was summer) was running a surplus, while most of the Northern Hemisphere (where it was winter) ran a deficit. The tropics, however, run a surplus pretty much all year round, which you can get a feel for by watching this animation of net radiation distribution from December 2001 to December 2002. In the animation, the low latitude regions that mark the tropics are always shaded in green (indicating a net gain in radiation).
Given the continuously large energy surplus at low latitudes, there is a zone of maximum heating called the thermal (heat) equator that exists. The thermal equator connects all the points that have the highest annual mean temperatures compared to other locations at their longitude. For the record, the thermal equator bears no relationship to the geographical equator. That's because mountain ranges, ocean currents, and differences in heating between continents and oceans naturally prevent a smooth, latitudinal variation in temperature in equatorial regions. The thermal equator lies mostly in the Northern Hemisphere, as the plot of mean annual temperature below shows, primarily because the Northern Hemisphere has more land at low latitudes (which, of course, becomes hotter than surrounding oceans with strong solar heating).
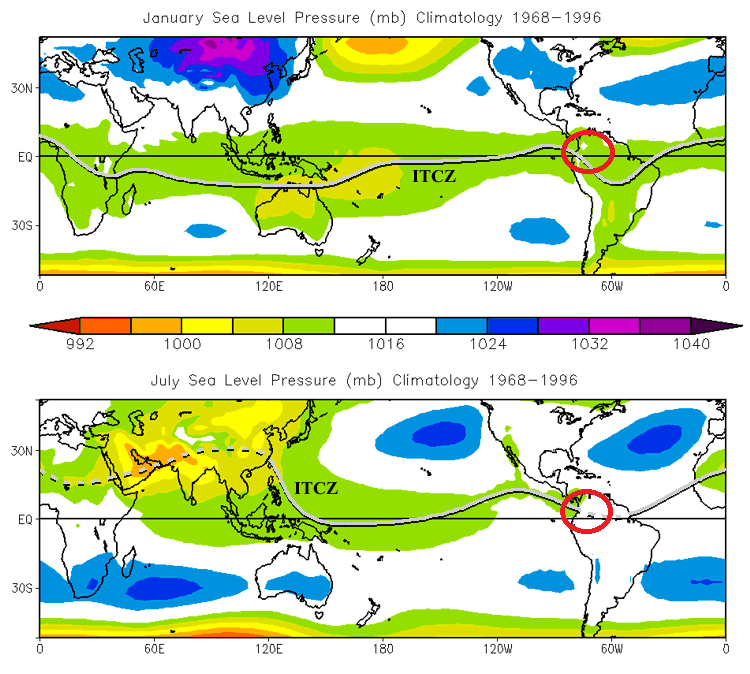
Furthermore, the thermal equator marks the average annual position of the ITCZ. Given the link between the ITCZ and high surface temperatures, the ITCZ lies in a trough of low pressure because high temperatures in the lower troposphere cause the air density (and weight) to decrease in local air columns, which, in turn, helps to promote lower surface pressure. Lower surface pressure is further promoted by the fact that air spreads out near the tropopause and flows poleward at the top of the ascending branch of the Hadley Cells. This upper-level divergence also helps reduce the weight of local air columns. Thus, analyses of sea-level pressure aid in finding the position of the ITCZ in real time (or over a given time period). For example, I drew the mean positions of the ITCZ during January and July using patterns of sea-level pressure as a guide below.
Note that in January, the ITCZ is mostly located in the Southern Hemisphere, where summer is occurring. But, the ITCZ drifts northward as the seasons change and is mostly located in the Northern Hemisphere in July (when it's summer in the Northern Hemisphere and solar heating is stronger there). On any given day, in response to maximum heating and low-level convergence, a ragged belt of cumulonimbus clouds fed by relative strong upward motion usually hangs like a necklace around the globe, marking the ITCZ.
I point out that, on any given day, the prevailing pattern of clouds associated with the ITCZ may not reflect a continuous belt of convection over equatorial latitudes, but tracking the rain that falls from showers and thunderstorms in the ITCZ can help us see how its position varies throughout the year. To see what I mean, check out this loop of monthly averages of rainfall (estimated from satellites) in millimeters per day, that fell from January 1999, to January 2003. The strong signal of rainfall associated with the ITCZ and the ascending branch of the Hadley Cells should be apparent to you. Clearly, the ITCZ "follows the sun" as it drifts north and south along with the belt of maximum solar heating throughout the year.
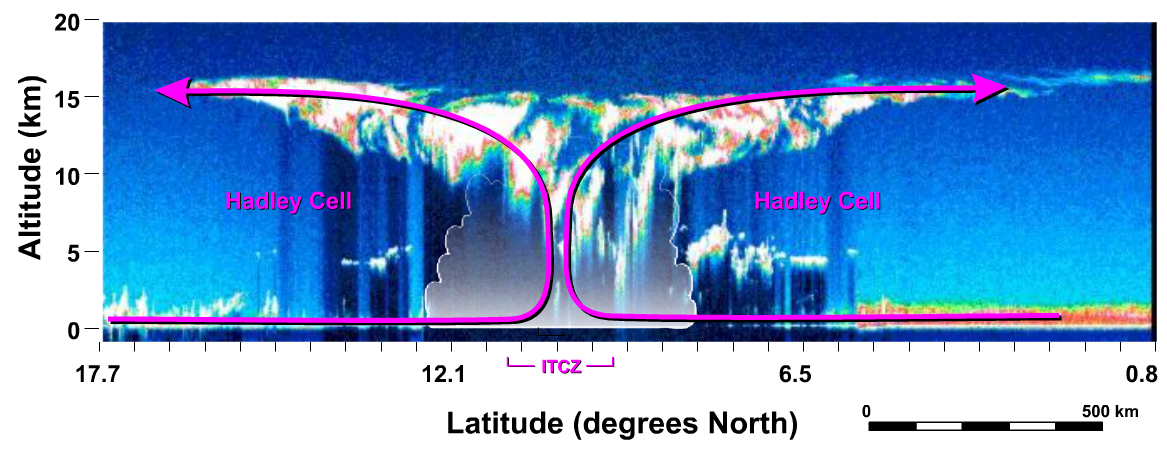
Since the ITCZ coincides with a belt of low sea-level pressure, low-level air flows horizontally and converges toward the thermal equator as the atmosphere attempts to equalize the weights of air columns. Those converging winds are indeed the trades. Check out this cross section schematic and note that the ITCZ corresponds with the ascending branch of the two Hadley Cells (one in each hemisphere). In case you're wondering, the background image was created by a down-looking LIDAR (a "light-equivalent" of radar that detects clouds) aboard the space shuttle Discovery. By the way, the zone where the opposing trade winds converge generally has light and variable winds. For this reason, this east-west belt is called the doldrums, which means "much rain and light winds".
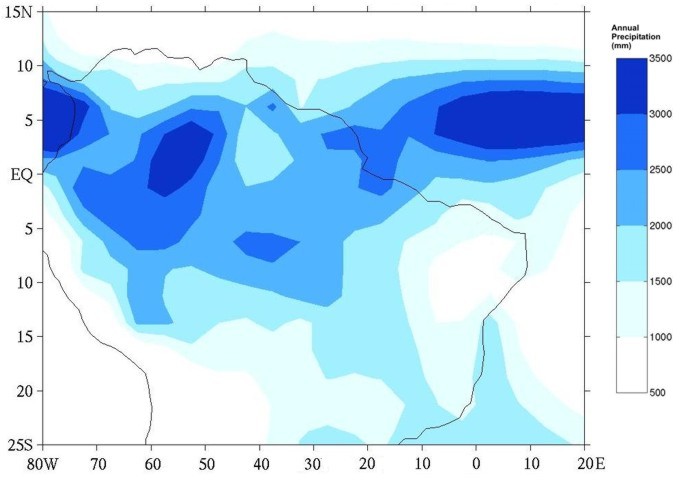
How much rain falls in the doldrums thanks to the ascending branch of the Hadley Cells? Let's focus in on a particular area to see. If you recall the figure showing the January and July positions of the ITCZ, you can see that the there's not much of a seasonal shift over northwestern South America near the Amazon River Basin. Thus, a recurrent dose of rising currents of humid air characterizes this region. Indeed, check out the annual mean precipitation over northern South America, which shows average rainfalls up to 3,500 millimeters (almost 140 inches) over the Amazon River Basin.
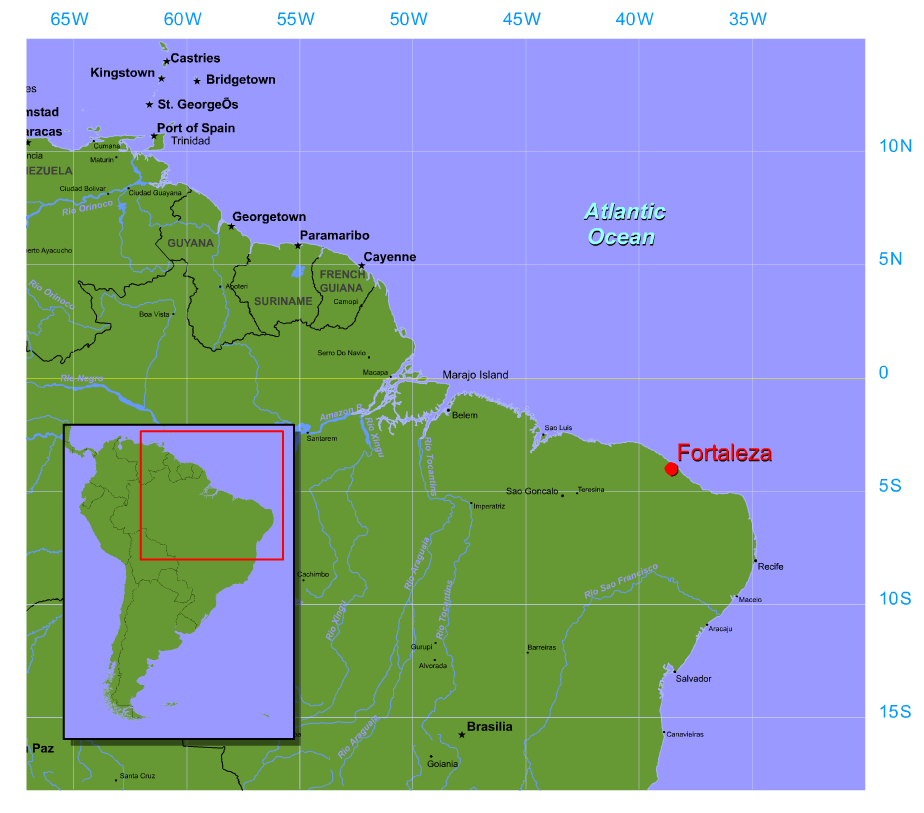
In regions where the position of the ITCZ varies more dramatically during the year (unlike the Amazon River Basin), a clear-cut wet and dry season emerge. Take, for example, the Brazilian city of Fortaleza, which is located on the northeast coast. In the animation below, you can review the monthly averages of rainfall and track the seasonal migration of the ITCZ with respect to Fortaleza on the inset map of global monthly precipitation. Note that the heavy rainfall associated with the ITCZ dips southward to Fortaleza's latitude and then retreats northward. This annual variation dictates that there are rainy and dry seasons at Fortaleza, as you can see from the bar graph of average monthly precipitation (late summer and fall mark Forteleza's dry season).
If you revisit the loop of monthly average rainfall from 1999 to 2003, the blotches of white (indicating very little precipitation) that line up at latitudes near 30-degrees South and North also stick out as curious features. Ultimately, what goes up in the ascending branches of the Hadley Cells, must come down, and these dry regions correspond to the sinking branches of the Hadley Cells. We'll explore them in the next section. Read on!