Prioritize...
Upon completion of this section, you should be able to discuss the changes in ocean temperatures in the equatorial Pacific Ocean associated with El Niño and La Niña, define "anomaly," and connect the development of El Niño and La Niña to changes in the trade winds.
Read...
I suspect that most folks have at least heard of El Niño and perhaps La Niña before. Other than tropical cyclones, they're probably the two tropical weather features that tend to make the news most often because of their impacts on global weather patterns. El Niño, in particular, has been the subject of cartoons and comics and has even been unforgettably spoofed on Saturday Night Live.
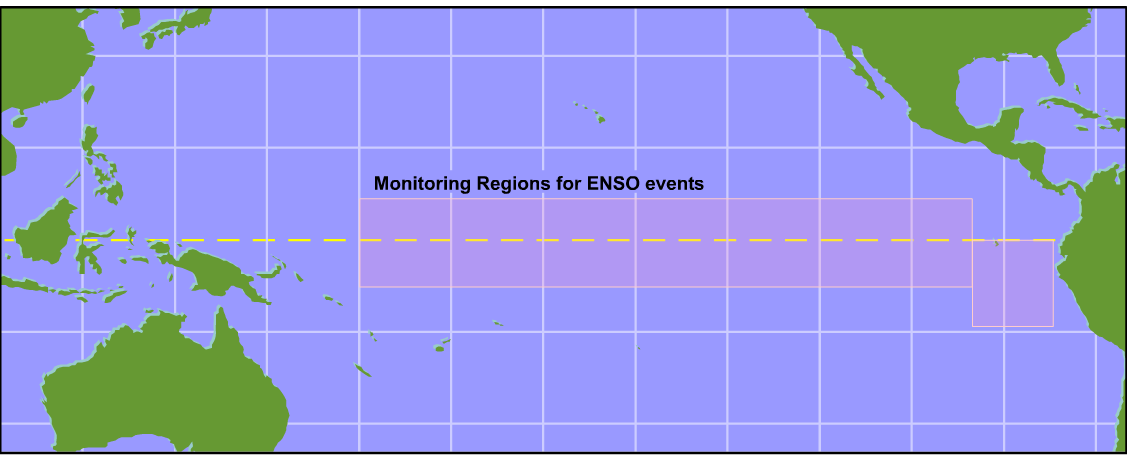
So, just what exactly are El Niño and La Niña? Well, they're not "tropical storms" (sorry, Saturday Night Live). El Niño is an unusual warming of the waters across the central and eastern equatorial Pacific (approximately from the international date line to the South American coast). La Niña is its cool counterpart. Together, El Niño and La Niña characterize the two phases of the El Niño--Southern Oscillation (ENSO, for short). For the record, the Climate Prediction Center declares the onset of El Niño when the three-month average of sea-surface temperatures in a strip between latitudes five degrees north and south and longitudes 170 degrees West and 120 degrees West exceeds the long-term average by at least 0.5 degrees Celsius. Conversely, the Climate Prediction Center declares a La Niña when the three-month average of sea-surface temperatures is at least 0.5 degrees Celsius below the long-term mean in a similar strip between 150 degrees West and 160 degrees East.
The term, El Niño, as it relates to our discussion, can be traced to the local name that Peruvian fisherman originally gave for the "hesitation" in the normally cold Humboldt ocean current off the west coast of South America that they noticed during December. By "hesitation", I mean the temporary replacement of the Humboldt Current by a weak (and warmer) current flowing southward from equatorial regions. The literal translation of El Niño (from Spanish) is "the boy child", which was a local reference to the Christ child because the "Humboldt hesitation" occurred around Christmastime.
In the context of a "hesitation", El Niño lasted a few to several weeks. Every two to seven years, however, a major breakdown of the Humboldt Current sends large-scale ripples through oceanic and atmospheric patterns over the course of months or even years, which leads to a protracted warming across the central and eastern equatorial Pacific (now known as El Niño). This cycle of warming can be seen in the time series of the sea-surface temperature "anomalies" (in degrees Celsius) in the central Pacific from 1950 through 2017 (below). An anomaly is merely the difference between an observation and the long-term average (anomaly = actual observation - long-term average). Therefore, positive sea-surface temperature anomalies represent warmer-than-normal conditions (marked by orange on the graph), while negative sea-surface temperature anomalies represent cooler-than-normal conditions (marked by blue on the graph). Note that the strongest El Niños occurred in 1982-1983, 1997-1998, and 2015-2016, but a number of other El Niño episodes (the threshold is marked by the faint red line on the graph) have occurred since 1950.
On the other hand, the graph above also shows that a periodic cooling of the waters in the central and eastern equatorial Pacific (La Niña episodes) often occurs in between El Niño episodes. So, what causes this cycle of warming and cooling in the equatorial Pacific? I'm not going to go into great detail about the formation mechanisms of El Niño and La Niña, as they can be complex (and if truth be told, still hold a few mysteries for scientists). But, I do want to give you a basic idea, and to do so, we have to talk a little bit about interactions between the atmosphere and ocean.
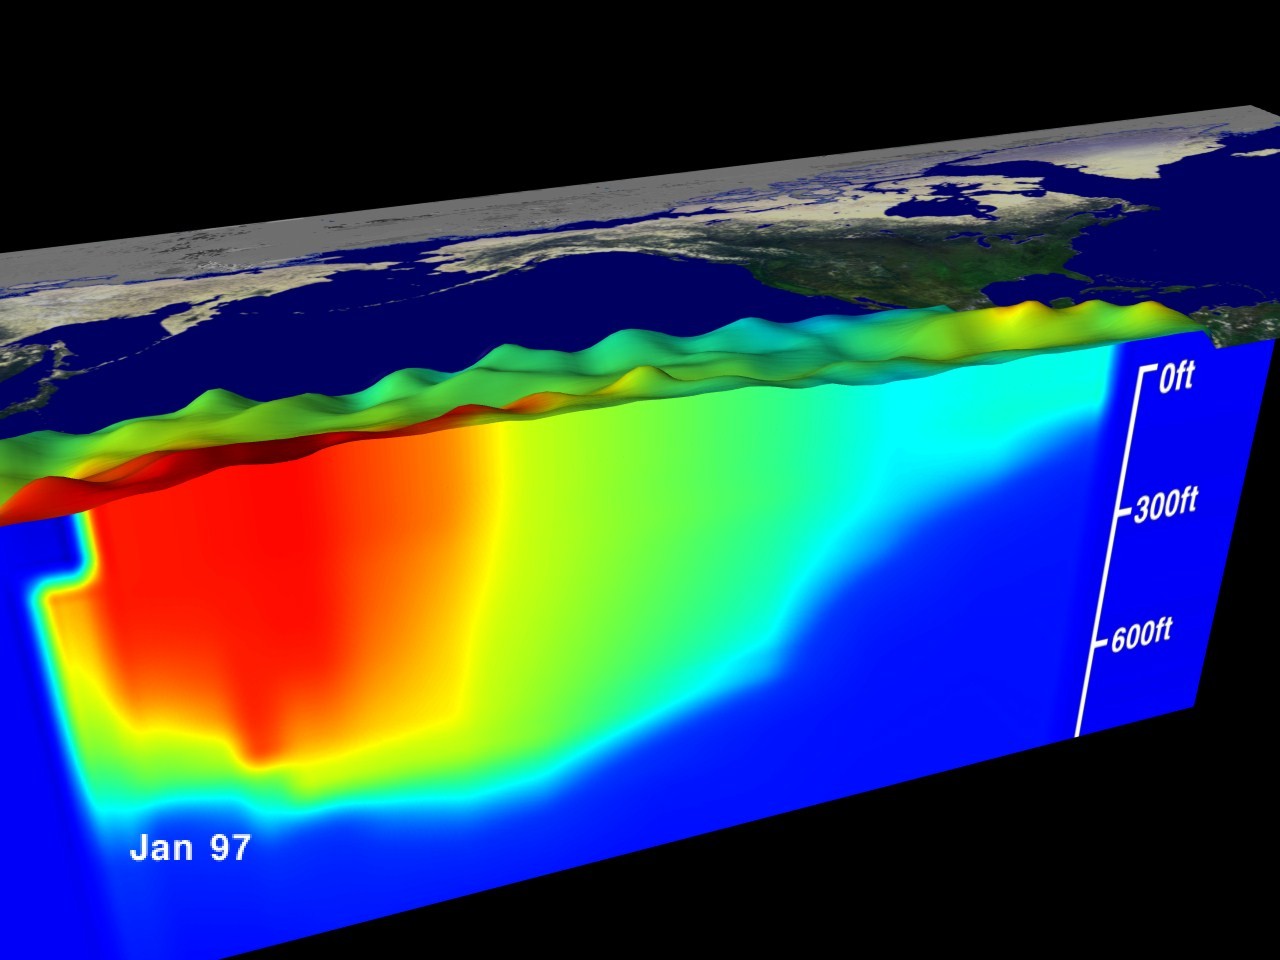
When winds blow over the ocean, they exert a "stress" on the surface water, setting it into motion. Given how persistent and reliable the trade winds are, they're very effective at moving ocean water around the tropics. The water doesn't actually move directly with the direction of the wind over time (thanks to the influence of the Coriolis Force), but the end result is that the northeasterly and southeasterly trade winds in the Pacific actually end up pushing water toward the western part of the Pacific basin. As a result, warm water piles up against Indonesia, forming a "mound" of warm water in the western equatorial Pacific. Additionally, this mound of water creates a sloped sea surface. That's right! The surface of the ocean is not flat! You can see this mound of warm water in the western Pacific on this cross-section of ocean temperatures and sea-surface heights from January 1997 (measured from satellites and ocean buoys).
This set up (a mound of warm water toward the western side of the Pacific) is considered the "normal" state of the Pacific Ocean, thanks to the trade winds. But, at irregular intervals every few years, the trade winds become less reliable and weaken. This weakening of the trade winds allows the mound of warm water in the western Pacific to slosh back eastward, warming the surface waters of the central and eastern Pacific, heralding the onset of El Niño. Watch the evolution of this process during the onset of the 1997-1998 El Niño in the animation of ocean temperatures and sea-surface heights from January 1997 through November 1998 below (0:46). Video has no audio.
Throughout 1997, you can see the mound of warm water slosh eastward as El Niño developed and continued into 1998. But, throughout 1998 the tide turned and the warm water returned to the western Pacific, while the central and eastern Pacific cooled, eventually leading to the La Niña later in 1999 (which actually lasted until 2001).
While a weakening of the trade winds heralds the onset of El Niño, the onset of La Niña is preceded by just the opposite -- a strengthening of the trade winds. When the trade winds strengthen, the mound of warm water in the western equatorial Pacific grows even more than normal, while the central and eastern Pacific become cooler than normal as deep, chilly water surfaces closer to South America.
I've skipped many details here (specifically relating to processes occurring beneath the ocean surface), but I wanted to give you a basic idea of the linkage between weakening trade winds and El Niño, and between strengthening trade winds and La Niña. To help you visualize the development of the unusually warm water in the central and eastern Pacific and see what an El Niño "looks like," check out the animation of global sea-surface temperature anomalies from January 2015 through August 2016 below. Throughout 2015, one of the strongest El Niño episodes on record developed (note pool of above normal sea-surface temperatures near the equator that extends toward the central Pacific from the West Coast of South America).
The 2015-2016 El Niño reached its peak during Northern Hemisphere winter (as is typical), and then during 2016, the El Niño weakened. By July and August, cooler-than-normal waters were evident in the equatorial central and eastern Pacific, signaling the development of La Niña.
Recall that for an El Niño or La Niña episode to be declared, sea-surface temperatures in the central and eastern Pacific need only be 0.5 degrees Celsius above or below normal, respectively (averaged over three months). So, what's the big deal about such seemingly innocuous departures from normal sea-surface temperatures? Well, over the course of several several months (or longer), these warmer or cooler waters modify the overlying atmosphere, and can ultimately have impacts reaching far and wide. What happens in the tropical Pacific does not stay in the tropical Pacific! We'll explore some of the local and global impacts of El Niño and La Niña in the next section.