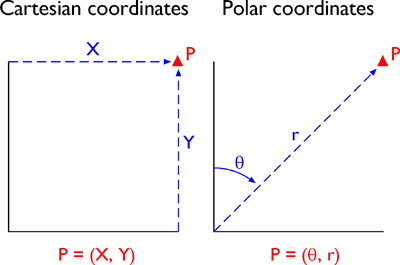
Some coordinate transformations are simple. For example, the transformation from non-georeferenced plane coordinates to non-georeferenced polar coordinates shown in Figure 2.18.1, below, involves nothing more than the replacement of one kind of coordinates with another.
Unfortunately, most plane coordinate transformation problems are not so simple. The geometries of non-georeferenced plane coordinate systems and georeferenced plane coordinate systems tend to be quite different, mainly because georeferenced plane coordinate systems are often projected. As you know, the act of projecting a nearly-spherical surface onto a two-dimensional plane necessarily distorts the geometry of the original spherical surface. Specifically, the scale of a projected map (or an unrectified aerial photograph, for that matter) varies from place to place. So long as the geographic area of interest is not too large, however, formulae like the ones described here can be effective in transforming a non-georeferenced plane coordinate system grid to match a georeferenced plane coordinate system grid with reasonable, and measurable, accuracy. We won't go into the math of the transformations here, since the formulae are implemented within GIS software. Instead, this section aims to familiarize you with how some common transformations work and how they may be used.
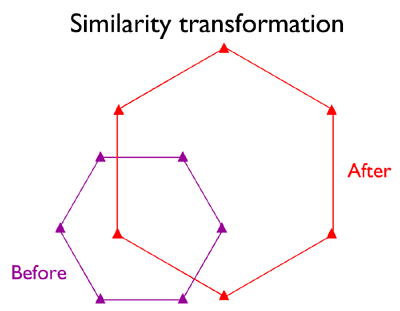
Similarity Transformation
In the hypothetical illustration below (Figure 2.18.2), the spatial arrangement of six control points digitized from a paper map ("before") are shown to differ from the spatial arrangement of the same points that appear in a georeferenced aerial photograph that is referenced to a different plane coordinate system grid ("after"). If, as shown, the arrangement of the two sets of points differs only in scale, rotation, and offset, a relatively simple four-parameter similarity transformation may do the trick. Your GIS software should derive the parameters for you by comparing the relative positions of the common points. Note that while only six control points are illustrated, ten to twenty control points are recommended (Chrisman 2002).
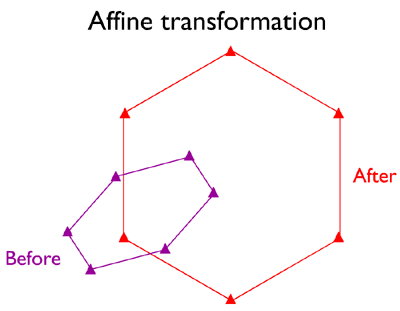
Affine Transformation
Sometimes a similarity transformation doesn't do the trick. For example, because paper maps expand and contract more along the paper grain than across the grain in response to changes in humidity, the scale of a paper map is likely to be slightly greater along one axis than the other. In such cases, a six-parameter affine transformation may be used to accommodate differences in scale, rotation, and offset along each of the two dimensions of the source and target coordinate systems. This characteristic is particularly useful for transforming image data scanned from polar-orbiting satellites whose orbits trace S-shaped paths over the rotating Earth.
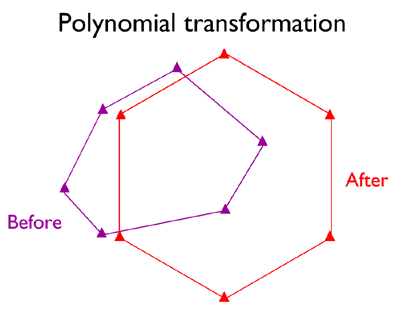
Second-Order Polynomial Transformation
When neither similarity nor affine transformations yield acceptable results, you may have to resort to a twelve-parameter Second-order polynomial transformation. Their advantage is the potential to correct data sets that are distorted in several ways at once. A disadvantage is that the stability of the results depend very much upon the quantity and arrangement of control points and the degree of dissimilarity of the source and target geometries (Iliffe 2000).
Even more elaborate plane transformation methods, known collectively as rubber sheeting, optimize the fit of a source data set to the geometry of a target data set as if the source data were mapped onto a stretchable sheet.
Root Mean Square Error
GIS software provides a statistical measure of how well a set of transformed control points match the positions of the same points in a target data set. Put simply, Root Mean Square (RMS) Error is the average of the distances (also known as residuals) between each pair of control points. What constitutes an acceptably low RMS Error depends on the nature of the project and the scale of analysis.