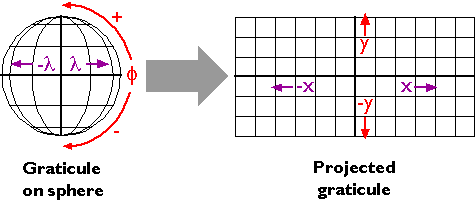
Latitude and longitude coordinates specify positions in a more-or-less spherical grid called the graticule. Plane coordinates like the eastings and northings in the Universal Transverse Mercator (UTM) and State Plane Coordinates (SPC) systems denote positions in flattened grids. This is why georeferenced plane coordinates are referred to as projected, and geographic coordinates are called unprojected. The mathematical equations used to transform latitude and longitude coordinates to plane coordinates are called map projections. Inverse projection formulae transform plane coordinates to geographic. The simplest kind of projection, illustrated in Figure 2.20.1, below, transforms the graticule into a rectangular grid in which all grid lines are straight, intersect at right angles, and are equally spaced. More complex projections yield grids in which the lengths, shapes, and spacing of the grid lines vary.
If you are a GIS practitioner, you have probably faced the need to superimpose unprojected latitude and longitude data onto projected data, and vice versa. For instance, you might have needed to merge geographic coordinates measured with a GPS receiver with digital data published by the USGS that are encoded as UTM coordinates. Modern GIS software provides sophisticated tools for projecting and unprojecting data. To use such tools most effectively, you need to understand the projection characteristics of the data sets you intend to merge. We'll examine map projections in some detail elsewhere in this chapter. Here, let's simply review the characteristics that are included in the "Spatial Reference Information" section of the metadata documents that (ideally!) accompany the data sets you might wish to incorporate in your GIS. These include:
- Projection Name Most common in the GIS realm is the Transverse Mercator, which serves as the basis of the global UTM plane coordinate system, the U.K. and proposed U.S. National Grids, and many zones in the U.S. State Plane Coordinate system (SPC). Other SPC zones are based upon the Lambert Conic Conformal projection, which like many projections is named for its inventor as well as its projection category (conic) and the geometric properties it preserves (conformal). Much map data, particularly in the form of printed paper maps, are based upon "legacy" projections (like the Polyconic in the U.S.) that are no longer widely used. A much greater variety of projection types tend to be used in small scale thematic mapping than in large scale reference mapping.
- Central Meridian Although no land masses are shown, let's assume that the graticule and projected grid shown above are centered on the intersection of the equator (0 latitude) and prime meridian (0° longitude). Most map projection formulae include a parameter that allows you to center the projected map upon any longitude.
- Latitude of Projection Origin Under certain conditions, most map projection formulae allows you to specify different aspects of the grid. Instead of the equatorial aspect illustrated above, you might specify a polar aspect or oblique aspect by varying the latitude of projection origin such that one of the poles, or any latitude between the pole and the equator, is centered in the projected map. As you might imagine, the appearance of the grid changes a lot when viewed at different aspects.
- Scale Factor at Central Meridian This is the ratio of map scale along the central meridian and the scale at a standard meridian, where scale distortion is zero. The scale factor at the central meridian is .9996 in each of the 60 UTM coordinate system zones since each contains two standard lines 180 kilometers west and east of the central meridian. Scale distortion increases with distance from standard lines in all projected coordinate systems.
- Standard Lines Some projections, including the Lambert Conic Conformal, include parameters by which you can specify one or two standard lines along which there is no scale distortion caused by the act of transforming the spherical grid into a flat grid. By the same reasoning that two standard lines are placed in each UTM zone to minimize distortion throughout the zone to a maximum of one part in 1000, two standard parallels are placed in each SPC zone that is based on a Lambert projection such that scale distortion is no worse than one part in 10,000 anywhere in the zone.