Another way to express map scale is with a graphic (or "bar") scale. Unlike representative fractions, graphic scales remain true when maps are shrunk or magnified.
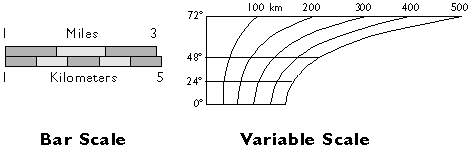
If they include a scale at all, most maps include a bar scale like the one shown above left (Figure 2.6.1). Some also express map scale as a representative fraction. Either way, the implication is that scale is uniform across the map. In fact, except for maps that show only very small areas, scale varies across every map. As you probably know, this follows from the fact that positions on the nearly-spherical Earth must be transformed to positions on two-dimensional sheets of paper. Systematic transformations of this kind are called map projections. As we will discuss in greater depth later in this chapter, all map projections are accompanied by deformation of features in some or all areas of the map. This deformation causes map scale to vary across the map. Representative fractions may, therefore, specify map scale along a line at which deformation is minimal (nominal scale). Bar scales denote only the nominal or average map scale. Variable scales, like the one illustrated above right, show how scale varies, in this case by latitude, due to deformation caused by map projection.