The Universal Transverse Mercator system is not really universal, but it does cover nearly the entire Earth surface. Only polar areas--latitudes higher than 84° North and 80° South--are excluded. (Polar coordinate systems are used to specify positions beyond these latitudes.) The UTM system divides the remainder of the Earth's surface into 60 zones, each spanning 6° of longitude. These are numbered west to east from 1 to 60, starting at 180° West longitude (roughly coincident with the International Date Line).
The illustration above (Figure 2.22.1) depicts UTM zones as if they were uniformly "wide" from the Equator to their northern and southern limits. In fact, since meridians converge toward the poles on the globe, every UTM zone tapers from 666,000 meters in "width" at the Equator (where 1° of longitude is about 111 kilometers in length) to only about 70,000 meters at 84° North and about 116,000 meters at 80° South.
"Transverse Mercator" refers to the manner in which geographic coordinates are transformed into plane coordinates. Such transformations are called map projections. The illustration below (Figure 2.22.2) shows the 60 UTM zones as they appear when projected using a Transverse Mercator map projection formula that is optimized for the UTM zone highlighted in yellow, Zone 30, which spans 6° West to 0° East longitude (the prime meridian).
As you can imagine, you can't flatten a globe without breaking or tearing it somehow. Similarly, the act of mathematically transforming geographic coordinates to plane coordinates necessarily displaces most (but not all) of the transformed coordinates to some extent. Because of this, map scale varies within projected (plane) UTM coordinate system grids.
The distortion ellipses plotted in red help us visualize the pattern of scale distortion associated with a particular projection. Had no distortion occurred in the process of projecting the map shown in Figure 2.22.2, below, all of the ellipses would be the same size, and circular in shape. As you can see, the ellipses centered within the highlighted UTM zone are all the same size and shape. Away from the highlighted zone, the ellipses steadily increase in size, although their shapes remain uniformly circular. This pattern indicates that scale distortion is minimal within Zone 30, and that map scale increases away from that zone. Furthermore, the ellipses reveal that the character of distortion associated with this projection is that shapes of features as they appear on a globe are preserved while their relative sizes are distorted. Map projections that preserve shape by sacrificing the fidelity of sizes are called conformal projections. The plane coordinate systems used most widely in the U.S., UTM and SPC (the State Plane Coordinates system) are both based upon conformal projections.
The Transverse Mercator projection illustrated above (Figure 2.22.2) minimizes distortion within UTM zone 30. Fifty-nine variations on this projection are used to minimize distortion in the other 59 UTM zones. In every case, distortion is no greater than 1 part in 1,000. This means that a 1,000 meter distance measured anywhere within a UTM zone will be no worse than + or - 1 meter off.
The animation linked to the illustration in Figure 2.22.3, below, shows a series of 60 Transverse Mercator projections that form the 60 zones of the UTM system. Each zone is based upon a unique Transverse Mercator map projection that minimizes distortion within that zone. Zones are numbered 1 to 60 eastward from the international date line. The animation begins with Zone 1.
Try This!
Click the graphic above in Figure 2.22.3 to download and view the animation file (utm.mp4) in a new tab.
Map projections are mathematical formulae used to transform geographic coordinates into plane coordinates. (Inverse projection formulae transform plane coordinates back into latitudes and longitudes.) "Transverse Mercator" is one of a hypothetically infinite number of such projection formulae. A visual analog to the Transverse Mercator projection appears below in Figure 2.22.4. Conceptually, the Transverse Mercator projection transfers positions on the globe to corresponding positions on a cylindrical surface, which is subsequently cut from end to end and flattened. In the illustration, the cylinder is tangent to the globe along one line, called the standard line. As shown in the little world map beside the globe and cylinder, scale distortion is minimal along the standard line and increases with distance from it. The animation linked above (Figure 2.22.3) was produced by rotating the cylinder 59 times at an increment of 6°.
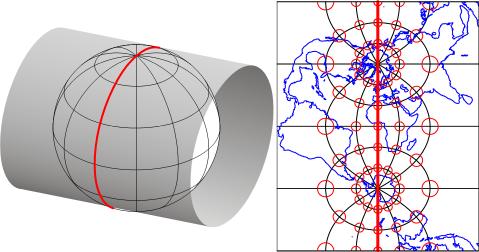
In the illustration above in Figure 2.22.4, there is one standard meridian. Some projection formulae, including the Transverse Mercator projection, allow two standard lines. Each of the 60 variations on the Transverse Mercator projection used as the foundations of the 60 UTM zones employ not one, but two, standard lines. These two standard lines are parallel to, and 180,000 meters east and west of, each central meridian. This scheme ensures that the maximum error associated with the projection due to scale distortion will be 1 part in 1,000 (at the outer edge of the zone at the equator). The error due to scale distortion at the central meridian is 1 part in 2,500. Distortion is zero, of course, along the standard lines.
So, what does the term "transverse" mean? This simply refers to the fact that the cylinder shown above in Figure 2.22.4 has been rotated 90° from the equatorial aspect of the standard Mercator projection, in which a single standard line coincides with 0° latitude.
One disadvantage of the UTM system is that multiple coordinate systems must be used to account for large entities. The lower 48 United States, for instance, spread across ten UTM zones. The fact that there are many narrow UTM zones can lead to confusion. For example, the city of Philadelphia, Pennsylvania is east of the city of Pittsburgh. If you compare the Eastings of centroids representing the two cities, however, Philadelphia's Easting (about 486,000 meters) is less than Pittsburgh's (about 586,000 meters). Why? Because although the cities are both located in the U.S. state of Pennsylvania, they are situated in two different UTM zones. As it happens, Philadelphia is closer to the origin of its Zone 18 than Pittsburgh is to the origin of its Zone 17. If you were to plot the points representing the two cities on a map, ignoring the fact that the two zones are two distinct coordinate systems, Philadelphia would appear to the west of Pittsburgh. Inexperienced GIS users make this mistake all the time. Fortunately, GIS software is getting sophisticated enough to recognize and merge different coordinate systems automatically.