One of the special characteristics of geographic data is that phenomena shown on maps tend to be represented differently at different scales. Typically, as scale decreases, so too does the number of different features and the detail with which they are represented. Not only printed maps, but also digital geographic data sets that cover extensive areas, tend to be more generalized than datasets that cover limited areas.
Accuracy also tends to vary in proportion with map scale. The United States Geological Survey, for example, guarantees that the mapped positions of 90 percent of well-defined points shown on its topographic map series at scales smaller than 1:20,000 will be within 0.02 inches of their actual positions on the map (see the National Geospatial Program Standards and Specifications). Notice that this "National Map Accuracy Standard" is scale-dependent. The allowable error of well-defined points (such as control points, road intersections, and such) on 1:250,000 scale topographic maps is thus 1 / 250,000 = 0.02 inches / Dg or Dg = 0.02 inches x 250,000 = 5,000 inches or 416.67 feet. Neither small-scale maps nor the digital data derived from them are reliable sources of detailed geographic information.
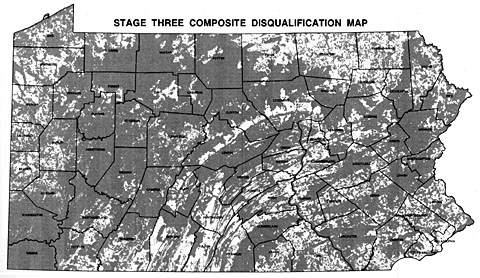
Sometimes the detail lost on small-scale maps causes serious problems. For example, a contractor hired to use GIS to find a suitable site for a low-level radioactive waste storage facility in Pennsylvania presented a series of 1:1,500,000 scale maps at public hearings around the state in the early 1990s. The scale was chosen so that disqualified areas of the entire state could be printed on a single 11 x 17-inch page. A report accompanying the map included the disclaimer that "it is possible that small areas of sufficient size for the LLRW disposal facility site may exist within regions that appear disqualified on the [map]. The detailed information for these small areas is retained within the GIS even though they are not visually illustrated..." (Chem-Nuclear Systems, Inc. 1993, p. 20). Unfortunately for the contractor, alert citizens recognized the shortcomings of the small-scale map, and newspapers published reports accusing the out-of-state company of providing inaccurate documents. Subsequent maps were produced at a scale large enough to discern 500-acre suitable areas.