The term "projection" implies that the ball-shaped net of parallels and meridians is transformed by casting its shadow upon some flat, or flattenable, surface. In fact, almost all map projection methods are mathematical equations. The analogy of an optical projection onto a flattenable surface is useful, however, as a means to classify the bewildering variety of projection equations devised over the past two thousand years or more.
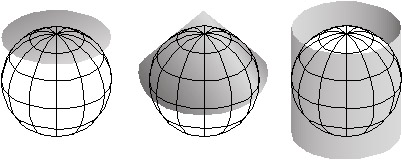
Imagine a model globe that is translucent, and contains a bright light bulb. Imagine the light literally casting shadows of the graticule, and of the shapes of the continents, onto another surface that touches the globe. As you might imagine, the appearance of the projected grid will change quite a lot depending on the type of surface it is projected onto, and how that surface is aligned with the globe. The three surfaces shown above in Figure 2.30.1--the disk-shaped plane, the cone, and the cylinder--represent categories that account for the majority of projection equations that are encoded in GIS software. All three are shown in their normal aspects. The plane often is centered upon a pole. The cone is typically aligned with the globe such that its line of contact (tangency) coincides with a parallel in the mid-latitudes. And the cylinder is frequently positioned tangent to the equator (unless it is rotated 90°, as it is in the Transverse Mercator projection). The following illustrations in Figure 2.30.2 show some of the projected graticules produced by projection equations in each category.
Cylindric projection equations yield projected graticules with straight meridians and parallels that intersect at right angles. The example shown above at top left in Figure 2.30.2 is a Cylindrical Equidistant (also called Plate Carrée or geographic) in its normal equatorial aspect.
Pseudocylindric projections are variants on cylindrics in which meridians are curved. The result of a Sinusoidal projection is shown above at top right of Figure 2.30.2.
Conic projections yield straight meridians that converge toward a single point at the poles, parallels that form concentric arcs. The example shown above, at bottom left in Figure 2.30.2, is the result of an Albers Conic Equal Area, which is frequently used for thematic mapping of mid latitude regions.
Planar projections also yield meridians that are straight and convergent, but parallels form concentric circles rather than arcs. Planar projections are also called azimuthal because every planar projection preserves the property of azimuthality. The projected graticule shown above at bottom right of Figure 2.30.2 is the result of an Azimuthal Equidistant projection in its normal polar aspect.
Appearances can be deceiving. It's important to remember that the look of a projected graticule depends on several projection parameters, including latitude of projection origin, central meridian, standard line(s), and others. Customized map projections may look entirely different from the archetypes described above.
Try This!
The Interactive Album of Map Projections 2.0 is an application developed by the Penn State Online Geospatial Education Programs and is an update of an earlier site that was inspired by the USGS Professional Paper 1453, An Album of Map Projections, by John P. Snyder and Philip M. Voxland.
Flex Projector is a free, open source software program developed in Java that supports many more projections and variable parameters than the Interactive Album. Bernhard Jenny of the Institute of Cartography at ETH Zurich created the program with assistance from Tom Patterson of the US National Park Service. You can download Flex Projector from flexprojector.com
Those who wish to explore map projections in greater depth than is possible in this text might wish to visit an informative page published by the International Institute for Geo-Information Science and Earth Observation (Netherlands), which is known by the legacy acronym ITC.