Plane coordinate systems pretend the world is flat. Obviously, if you flatten the entire globe to a plane surface, the sizes and shapes of the land masses will be distorted, as will distances and directions between most points. If your area of interest is small enough, however, and if you flatten it cleverly, you can get away with a minimum of distortion. The basic design problem that confronted the geodesists who designed the State Plane Coordinate System, then, was to establish coordinate system zones that were small enough to minimize distortion to an acceptable level, but large enough to be useful.
The State Plane Coordinate System of 1983 (SPC) is made up of 124 zones that cover the 50 U.S. states. As shown below in Figure 2.26.1, some states are covered with a single zone while others are divided into multiple zones. Each zone is based upon a unique map projection that minimizes distortion in that zone to 1 part in 10,000 or better. In other words, a distance measurement of 10,000 meters will be at worst one meter off (not including instrument error, human error, etc.). The error rate varies across each zone, from zero along the projection's standard lines to the maximum at points farthest from the standard lines. Errors will accrue at a rate much lower than the maximum at most locations within a given SPC zone. SPC zones achieve better accuracy than UTM zones because they cover smaller areas, and so are less susceptible to projection-related distortion.
Most SPC zones are based on either a Transverse Mercator or Lambert Conic Conformal map projection whose parameters (such as standard line(s) and central meridians) are optimized for each particular zone. "Tall" zones like those in New York state, Illinois, and Idaho are based upon unique Transverse Mercator projections that minimize distortion by running two standard lines north-south on either side of the central meridian of each zone. "Wide" zones like those in Pennsylvania, Kansas, and California are based on unique Lambert Conformal Conic projections that run two standard parallels west-east through each zone. (One of Alaska's zones is based upon an "oblique" variant of the Mercator projection. That means that instead of standard lines parallel to a central meridian, as in the transverse case, the Oblique Mercator runs two standard lines that are tilted so as to minimize distortion along the Alaskan panhandle.)
The two types of map projections share the property of conformality, which means that angles plotted in the coordinate system are equal to angles measured on the surface of the Earth. As you can imagine, conformality is a useful property for land surveyors, who make their livings measuring angles. (Surveyors measure distances too, but unfortunately there is no map projection that can preserve true distances everywhere within a plane coordinate system.) Let's consider these two types of map projections briefly.
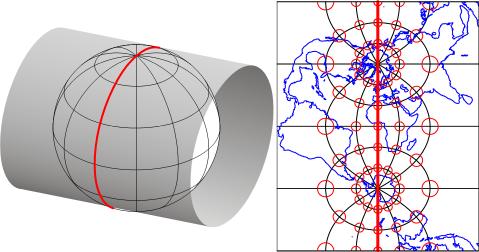
Like most map projections, the Transverse Mercator projection is actually a mathematical transformation. The illustration below in Figure 2.26.2 may help you understand how the math works. Conceptually, the Transverse Mercator projection transfers positions on the globe to corresponding positions on a cylindrical surface, which is subsequently cut from end to end and flattened. In the illustration, the cylinder is tangent to (touches) the globe along one line, the standard line (specifically, the standard meridian). As shown in the little world map beside the globe and cylinder, scale distortion is minimal along the standard line and increases with distance from it.
The distortion ellipses plotted in red help us visualize the pattern of scale distortion associated with a generic Transverse Mercator projection. Had no distortion occurred in the process of projecting the map shown below, all of the ellipses would be the same size, and circular in shape. As you can see, the ellipses plotted along the central meridian are all the same size and circular shape. Away from the central meridian, the ellipses steadily increase in size, although their shapes remain uniformly circular. This pattern reflects the fact that scale distortion increases with distance from the standard line. Furthermore, the ellipses reveal that the character of distortion associated with this projection is that shapes of features as they appear on a globe are preserved while their relative sizes are distorted. By preserving true angles, conformal projections like the Mercator (including its transverse and oblique variants) also preserve shapes.
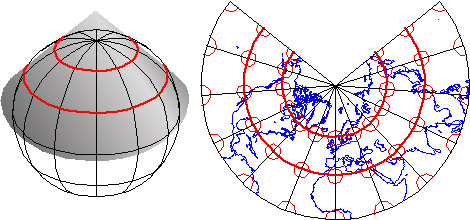
SPC zones that trend west to east (including Pennsylvania's) are based on unique Lambert Conformal Conic projections. Instead of the cylindrical projection surface used by projections like the Mercator, the Lambert Conformal Conic and map projections like it employ conical projection surfaces like the one shown below in Figure 2.26.3. Notice the two lines at which the globe and the cone intersect. Both of these are standard lines; specifically, standard parallels. The latitudes of the standard parallels selected for each SPC zones minimize scale distortion throughout that zone.