
Processes that Cause Sea Level to Rise
For most people, sea level rise is caused by melting ice sheets. It is so easy to visualize a glacier melting into the ocean. As it turns out, an equally important factor is the expansion of seawater as it warms. In this section, we explore these different mechanisms in some detail.
Growth and Melting of Ice Sheets
How are absolute changes in sea level caused? As we have seen, the most direct way is through the growth and melting of the major ice sheets as discussed in the following video.
Video: NASA: A Tour of the Cryosphere 2009 (5:12)
[MUSIC]
NARRATOR: Though cold and often remote, the icy reaches of the Arctic, Antarctic, and other frozen places, affect the lives of everyone on Earth. We start our tour in Antarctica. Where they meet the sea, mountains of ice crack and crumble. The resulting icebergs can float for years. Ice shelves surround half the continent. They slow the relentless march of ice streams and glaciers like dams hold back rivers. But the region is changing.
As temperatures increase, we see a growing number of melt ponds. As this heavy meltwater forces its way into cracks, ice shelves weaken and can ultimately collapse. After twelve thousand years, the Larsen B Ice Shelf collapsed in just five weeks. Offshore, sea ice forms when the surface of the ocean freezes, pushing salt out of the ice. The cold, salty, surface water starts to sink, pumping deeper water out of the way powering global ocean circulation. These currents influence climate worldwide. Most ice exists in the cold polar regions, but we see glaciers like these in the Andes, all over the world. Most are shrinking.
Here in North America, millions of people experience the cryosphere every year. Eastward moving storms deposit snow, like thick paint brushes. Mountain snow packs store water. Snowmelt provides three-quarters of the water resources used in the American West. Substantial winter snows produced a green Colorado in 2003, but drier conditions the previous year limited vegetation growth and increased the risk of fires. In the Rocky Mountains, there are patches of frozen ground called permafrost that never thaw.
These regions are unusual in the mid-latitudes, but farther north, permafrost is more widespread and continuous, covering nearly a fifth of the land surface in the northern hemisphere. Sea ice varies from season to season and from year to year. Data show that Arctic sea ice has shrunk dramatically in the last few decades. The effects could be profound. As polar ice decreases, more open water could promote greater heating. More heating could lead to faster melting, reinforcing the cycle. If this trend continues, the Arctic Ocean could be ice-free in the summer by the end of the century. These changes in ice cover are not limited to oceans.
Greenland's ice sheet contains nearly 10% of the Earth's glacial ice. Glaciers in western Greenland produce most of the icebergs in the North Atlantic. After decades of stability, Greenland's Jakobshavn ice stream, one of the fastest flowing glaciers in the world, has changed dramatically. The ice has thinned and the front retreated significantly. Between 1997 and 2003, the glacier's flow rate nearly doubled to 5 feet an hour. These are just some of the cryospheric processes that NASA satellites observe from space. Continued observation provides a critical global perspective, as our home planet continues to change day to day, year to year, and further into the future.
Iceberg Images
The following videos describe melting of ice sheets on Greenland and Antarctica.
Video: Must see video of Greenland melting (2009.02.20)(3:00)
Narrator: Glaciologist Jason Box and physicists Basil Singer are in Greenland to see if they can save the planet’s glaciers. They want to measure just how fast this one is melting. Jason: The Mulan is really the epicenter of our concern. Because all the water is channeling down into this one point, by measuring the flow rates, we can understand how much water is going into the glacier. Oh, wow. Basil: Whoa! Jason: Welcome to the epicenter of global warming. This is bottomless. No light escapes. Narrator: Basil has volunteered to take the first reading. Basil: Just walk it back. Don't lean towards me, lean back. That looks extremely scary. Jason: The only way to know how much water is going into the Mulan is by sticking our sensors in and making a measurement right there, next to a bottomless pit. Basil: The water drops for a whole mile. You would not want to fall down there. Jason: There's no escape from a Mulan. Basil: Look up! Look up! Jason: It's just got danger written all over it. I never thought I'd be standing at the edge of the abyss like this. Basil: I'm so scared. Jason: But the information is so important we actually have to take that risk. Let's make these measurements and get out of harm's way. Narrator: They use a flow meter to measure the water speed. Jason: Let's see how fast the water’s dumping into this hole. Basil: So, we're measuring the flow rate now. Jason: Dab it in there. Basil: Whoa, that's so strong. Look at that, whoa. There's so much energy here, that's the force of this water. Jason: What's the speed? Basil: That peaked at nine point four miles an hour. That's really moving. This must be about a thousand cubic feet per second. This is more melt than I was expecting. Basil: On a scale from zero to ten how serious is this melt issue? Jason: It's an 11. Narrator: In just one day, nearly 42 million litres of fresh water drain down this one Mulan alone, and Jason believes there are hundreds, possibly thousands more of them, on the Greenland ice cap. The data sends a chill up Basil’s spine, and it's not from the cold. At this rate of melting, Greenland is losing enough water each year to cover Germany a meter deep.
Video: Antarctic Wilkins Ice Shelf Collapse (2:20). This video is set to music and not narrated.
This process has been active over much of geologic time, all except for the very warmest time periods when there were no polar ice sheets. If we were to melt all of the ice on Antarctica and Greenland, we would see a sea level rise of almost 70 meters (Greenland would cause about 6 m of sea level rise, Antarctica about 60 m). This would take melting of the relatively stable interior of the ice sheets which will take thousands of years to occur if modern warming rates continue unabated. However, there is much we do not understand about the behavior of the more dynamic areas of the ice sheets closer to the edges and this imparts a great deal of uncertainty to any predictions of sea level rise in the coming centuries.
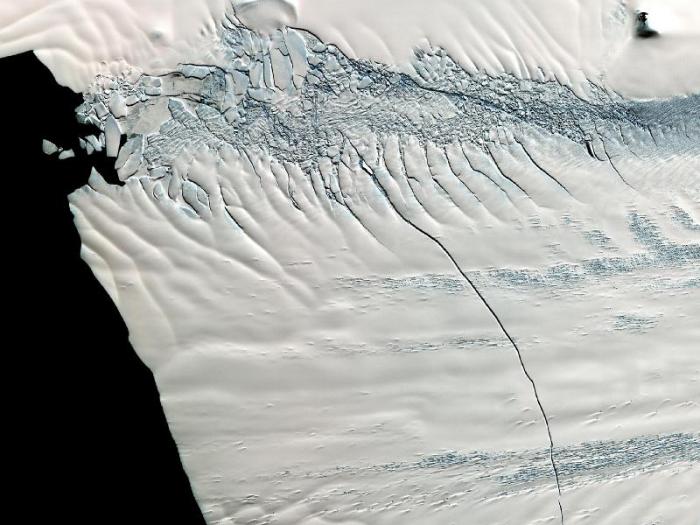
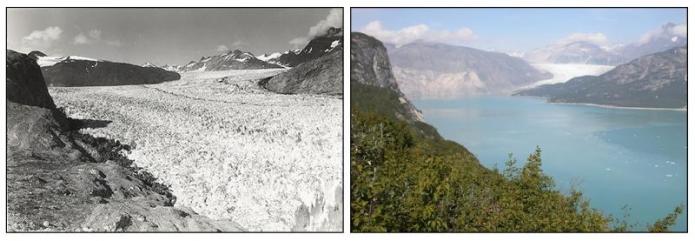
New research appears all the time that shows vulnerable parts of the Antarctic ice sheet, especially its shelves. Geologists are able to use radar instruments to image the base of the ice shelf and the seabed. Ice shelves refer to places where ice overlies sea water or bedrock that is below sea level. Recently, glaciologists have found places in West Antarctica where the underlying seabed is much smoother than expected, meaning that the glacier can advance readily under the right circumstances. Moreover, some of these places are vulnerable to being heated by warm ocean currents in the future. We presented the physical evidence for ice melting in Module 2, below are before and after photos from Alaska to remind you.
The second process that is causing sea level rise on human time scales is the physical expansion of seawater as a result of temperature increase. When materials are heated, they expand and, in the case of the oceans, this causes the surface of the water to rise. This thermal mechanism can cause absolute sea level changes on the order of millimeters and centimeters per decade. It varies geographically depending on how fast the ocean is warming in individual locations and temporally depending on variations in ocean temperatures associated with climate oscillations such as El Niño . Hard as it is to imagine with all of the press attention over melting ice, but thermal expansion may actually cause more sea level rise in the 21st century.
The following video describes how satellites provide a very detailed picture of sea level change.
Video: NASA Climate Science Expert Josh Willis (3:50)
Global sea-level change has been really interesting in the last year because global sea level actually fell between 2010 and 2011. It wasn't a huge drop, it was about five millimeters. And over the last 20 years, sea levels gone up by about five centimeters. So, we're talking about a sort of 10% signal. But nevertheless, it's something we can measure, and it's something that's kind of created a lot of excitement in the sea-level community and people that study global warming and sea-level rise. One of the most amazing tools we have, for measuring where the water is going, is the grace satellites. This is actually a pair of satellites that chase each other around as they go and orbit around the planet. And whenever one goes over something heavy, it actually speeds up a little bit from the pull of gravity. Then, when the second one follows, it flies over the heavy thing too, and it catches up a little bit. And by measuring the distance between these two things very, very accurately, we can actually weigh the things that they're flying over. And what it's telling us this year is that the ocean actually lost weight. Water actually was transferred out of the ocean and back on to land. So, what happened? Well, in 2010 there was a massive El Niño out of the Pacific Ocean, and it was followed immediately by a really, really strong La Niña, one of the biggest ones we've had in decades. Now, El Niño and La Niña have a big impact on rainfall, and what happened this year was, rainfall that normally falls over the ocean was shifted over the land. And the net effect was that water was carried from the ocean and on to the land, and this caused a drop in sea-level rise. Now, the question is, “Is this drop doing to continue?”, and the answer is probably “no”. We know that El Niño is a cyclic phenomenon, and also we can see where most of the water went. In this case, it went in South America, Australia, Indonesia, and Southeast Asia. The ice sheets actually continued to lose mass. So, Greenland and Antarctica still continued to dump ice into the ocean. But the effect of the El Niño was so big it swamped that for just a little while. Australia had enormous floods last year. South America had a huge drought in 2010, and it was followed by flooding in 2011. So, these represent massive movements of water around on the continents and between the ocean and the land. These places are close to the equator; they’re at low latitudes. It's pretty warm. It's not like it was piling on to the ice sheets. So, that means at another year, maybe two, this water is going to find its way back into the oceans, and we're going to see sea level begin to rise again. In fact, the most recent observations suggest that that's already started. So, the long-term outlook is definitely one of rising sea level and global warming.
In the past, the significant sea-level rise was caused by major episodes of volcanism that added crust in the ocean basins and displaced seawater towards land. This happened when processes deep in the interior of the earth caused seafloor spreading rates to increase and massive eruptions of volcanic submarine plateaus away from the ridge. These processes occur on very long or geological time scales and are not a factor today.