Shoreline Effects of Storms
In “Beaches are Moving: The Drowning of America’s Shoreline”, coastal geologist and author Orrin Pilkey discusses the four components of shoreline equilibrium – material, energy, shape, and sea level, and how they interact in the event of a storm. He states: “During a storm the strong wind and waves pick up much more sediment than usual, carrying it inland into the dunes or seaward into the waves”…. “Covered by the storm surge, the beach temporarily loses its usual position in the marine environment and becomes an underwater or offshore bar... …the boiling surf keeps the sand particles in suspension, and because the energy of the big waves reaches deeper water, the sand cannot settle until it is either far offshore… or until it is washed up on land to reshape the beach”.
The result, after a storm has passed, is a very different shoreline than before. The energy of water is awesome in its ability to move sediment from one place and deposit in another. This is often in conflict with the human desire to stabilize and prevent shorelines from moving. But storms and the shoreline naturally interact in a dynamic way. Humans place structures on shorelines, and they get destroyed and rebuilt. But this cannot go on indefinitely.
A point that Dr. Pilkey repeatedly makes is that storms and shorelines are the natural state in a “constant, dynamic balancing of materials, energies and shapes”. When people attempt to change this dynamic equilibrium is when a catastrophe happens. This is something to keep in mind as we consider the impacts of the storms we have discussed in this module and as we move forward to explore ways communities deal with these impacts.
Dr. Sean Cornell of Shippensburg University, who does fieldwork on Wallops Island, captured the following images documenting the impacts to the barrier island after Hurricane Irene in 2011. Read through his description and examine the photographs to learn about the local impacts of a hurricane on a barrier island beach. He contrasts Hurricane Irene with Hurricane Sandy, pointing to the difference in angle of approach.
Irene developed as a tropical storm some 300 km off the eastern end of the Lesser Antilles and outside of the Caribbean Sea. It first became a hurricane on August 22, 2011 as it made landfall on Puerto Rico. Despite making landfall, the storm continued to strengthen and eventually became a Category 3 hurricane as it passed through the Bahamas on August 24. The storm then tracked northward and impacted the Outer Banks of North Carolina as a Category 1 storm before emerging once again out into the Atlantic Ocean off the coast of Virginia just south of Virginia Beach on August 28.
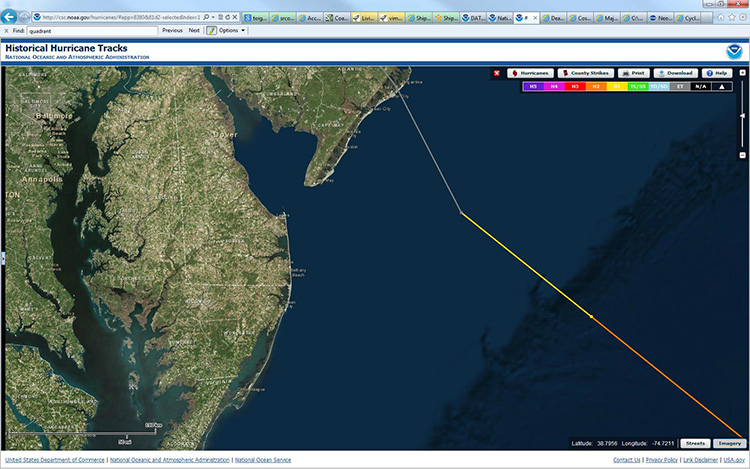
As the storm moved northeastward, it ran parallel to the shoreline of the Delmarva Peninsula, where it produced strong winds and waves and high water for the barrier islands and coastal bays located behind the barrier islands including Wallops Island, home of NASA’s Wallops Island Flight Facility, as well as Chincoteague and Assateague Islands. These barrier islands are nearly continuous along a distance of almost 150 miles of shoreline between the Chesapeake and Delaware Bays. They are interrupted only occasionally by relatively narrow inlets. Nearly 80 miles of this shoreline is relatively undisturbed and undeveloped and is generally allowed to behave naturally and without significant modification by human activity (although see the impact of constructed shorelines at Ocean City, Maryland and recent coastal engineering projects on Wallops Island to help protect the launch facility and infrastructure). Centered in this region is one of the largest bays on the Delmarva. Chincoteague Bay straddles the Virginia-Maryland border and today has two inlets to the ocean, one between Wallops Island and Assateague Island (i.e., the Chincoteague Inlet), on the south and one between Assateague and Fenwick Island on the north (i.e., the Ocean City Inlet; see figure below).
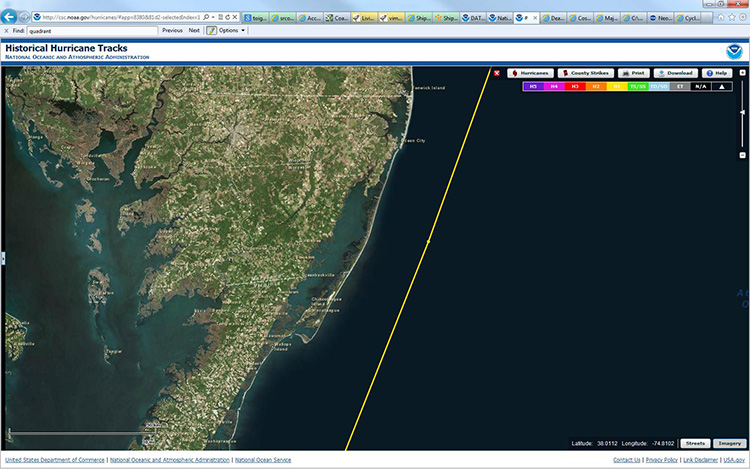
Screenshot from the Historical Hurricane Tracks database showing the track of Hurricane Irene as it tracked northeastward along the Delmarva as a Category 1 Hurricane. The locations of Chincoteague Bay, Wallops, Assateague, and Fenwick Islands are noted, as is the position of Ocean City, Maryland.
For the Eastern Shore of Virginia, and although it was relatively fast-moving, Hurricane Irene was a significant event as the center of the storm passed only about 30 miles offshore. During the onset of the storm, onshore winds and waves piled significant volumes of water along the barrier islands producing storm overwash, eroding shorelines (see images below), and relatively robust storm surge in back bay areas along the mainland (see images below), although nothing is comparable to the levels observed during Katrina on the Gulf Coast, or during Hurricane Sandy in New York. This was, in part, because of the trajectory of the storm, the speed of the storm, the fact that it moved along the continental shelf, and also because the number of inlets was relatively few and narrow. These factors, combined with the robust nature of the barrier island maritime forests and dune systems, helped reduce the total volume of water that could enter the coastal bays. As the storm moved north of the region, offshore winds on the trailing edge of the storm helped to push surge waters back out of the bays and helped produce extensive scouring in the vicinity of the unprotected inlet. This helped form a large ebb-tidal delta that helped fill in much of the navigational channel between Assateague and Wallops. Thus, for this region, Hurricane Irene’s impact was significant but could have been much worse if the storm’s trajectory was different.
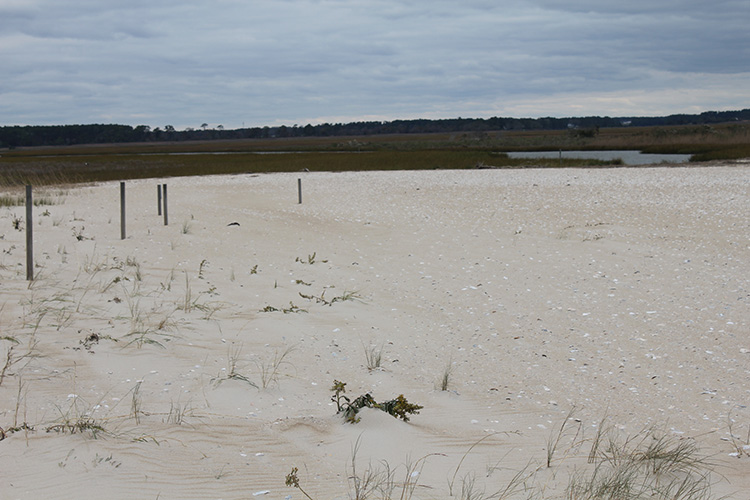
View to the west toward the mainland and salt marsh from the overwash fan on the southernmost tip of Wallops Island at the site of the former inlet separating Wallops from the barrier island to the south. This overwash fan was initiated during Hurricane Irene and was reactivated during Hurricane Sandy as even more wave action pushed the front edge of the island over itself and backward into the salt marsh as part of the process called barrier island rollback. Photo taken 11/2012.
Credit: Nick Matthews
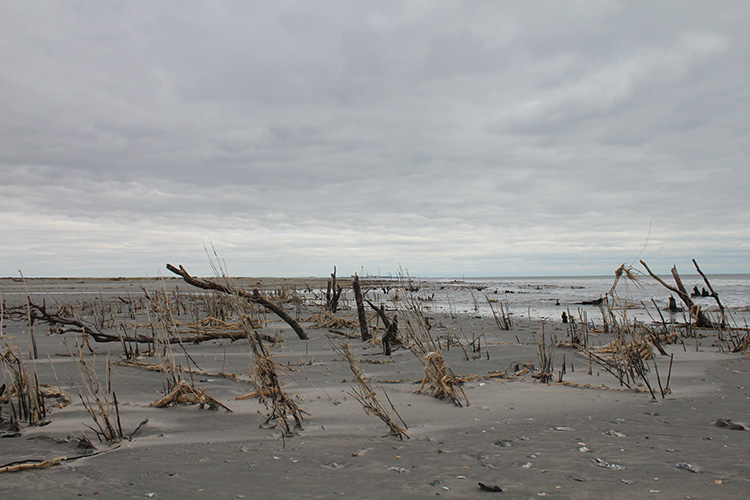
View to the north on the southern tip of Wallops Island on the seaside of the barrier island. Former inter-dune and dune scrub habitat are now exposed in the surf as a result of high water and erosive waves that scoured away the dunes and flattened the beach. Note a number of tree stumps in the surf. Sediments were moved backward over the island as part of overwash while some sediment was pulled offshore. As a result of both Hurricane Irene and Sandy, this part of the shoreline retreated landward by more than 4 meters. Photo taken 11/2012.
Credit: Nick Matthews
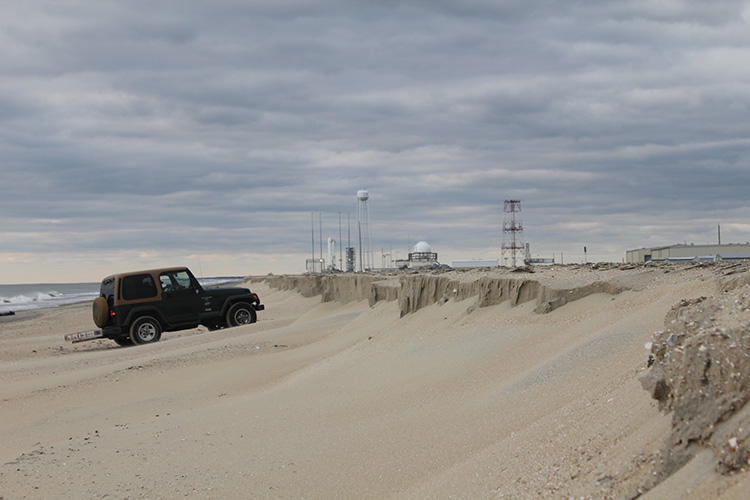
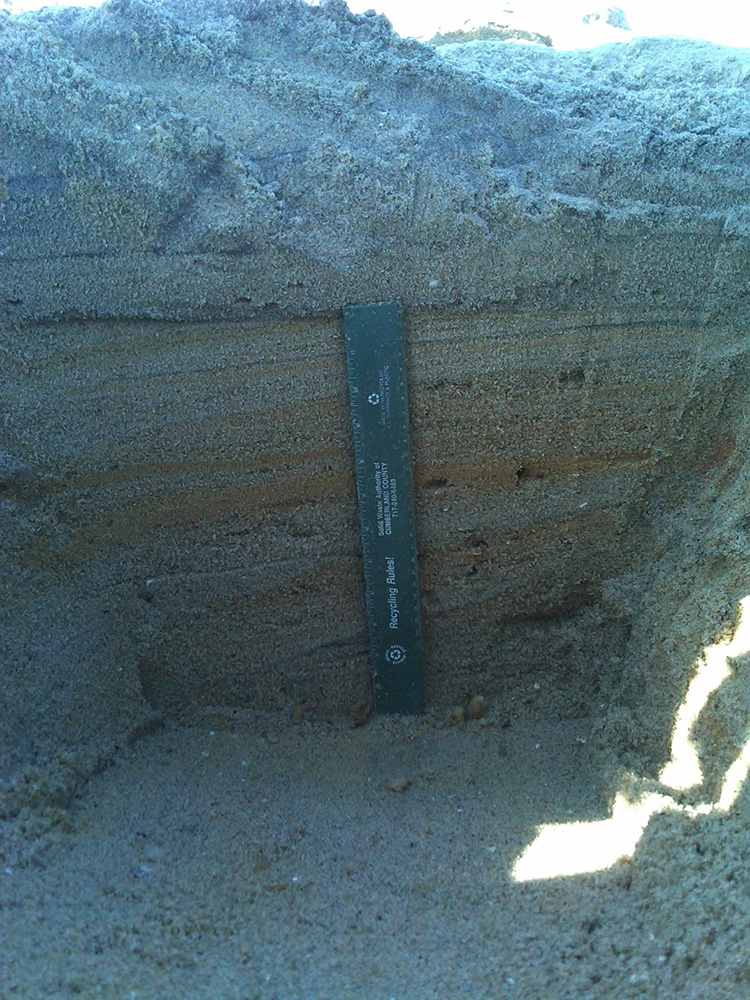
Photo of the Hurricane Sandy storm scarp produced by beach erosion midway up the newly replenished shoreline at Wallops Island. Finished in the summer of 2012 after Hurricane Irene, an extensive shoreline replenishment project was undertaken to help protect NASA’s launch infrastructure. Although erosion was significant, the amount of damage produced by Sandy, compared to Irene, was significantly less – in part because this new higher beach protected shoreline and prevented overwash in this area. Jeep Cherokee for scale. Photo November 2012.
Credit: Nick Matthews
View northward on Wallops showing the southern end of the replenishment area. Prior to shoreline replenishment with offshore sands, NASA had previously utilized geotubes filled with sand to act as wave breaks to help slow erosion and minimize overwash especially in the vicinity of the UAV runway at the southern end of the island. During Hurricane Irene, these tubes took the brunt of the storm’s fury and some were completely destroyed. These were buried by the replenishment project, but intensive wave scour re-exhumed portions of the tubes. Subsequent to Hurricane Sandy, dune building processes have helped to partially rebury the tubes.
Credit: Sean Cornell
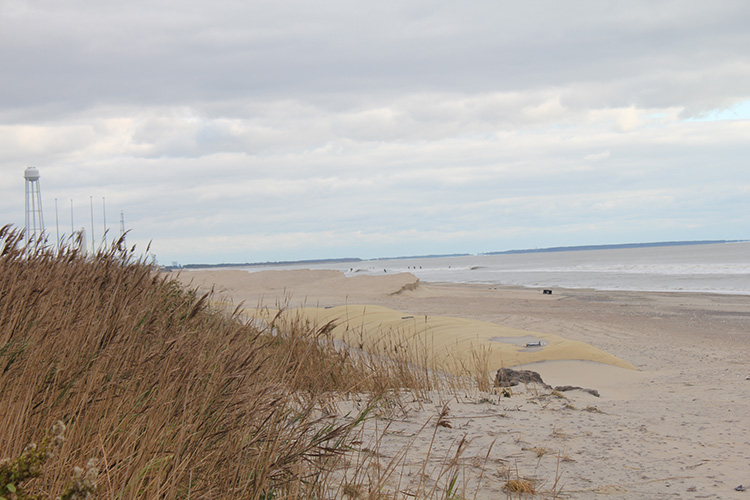
Erosion was also significant during Hurricane Sandy and Katrina on the barrier islands. In this location on the northern end of Wallops Island, Virginia, near the Chincoteague Inlet, an entire beach and dune system was eroded adjacent to the inlet. The amount of erosion was so substantial that waves removed a 10-meter wide beach and a line of dunes that were built to a height of 8' to 9’ above the normal high tide line. The erosive scour exposed and eroded a line of trees and coastal shrubs that are seen in this photo. In this case, much of the erosion occurred after the storms moved north as storm surge waters rushed back out of Chincoteague Bay through the inlet to the ocean. The ebbing storm tide produced a very strong current that scoured out the margins of the inlet and deposited those sediments in the ebb-tidal delta outside of the inlet. Due to wave action since the storm, many of these sediments are being reworked and a new beach and dune system is being developed where it was formerly eroded from.
Credit: Sean Cornell
Hurricane Irene storm deposit on the parking lot of the Assateague National Seashore (September 2011). High waves and storm surge deposited well over 16” of sand (part of the overwash fan) on the beach access parking lot. As a result, hundreds of cubic meters of sand had to be removed by the National Park Service in order to re-open the parking for Labor Day beachgoers just a few days after Hurricane Irene. Even so, only a few of the 900 parking spaces could be used.
Credit: Sean Cornell
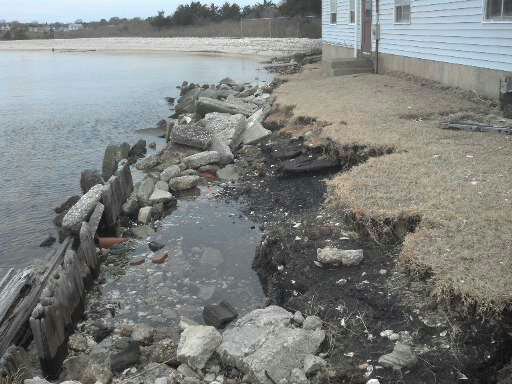
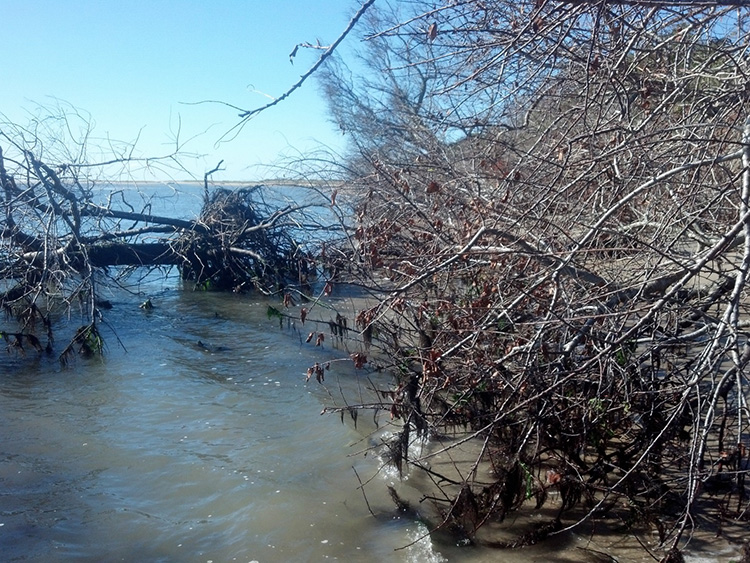
Shoreline erosion on the mainland side of Chincoteague Bay, Virginia as a result of Hurricane Irene and Sandy. Storm surge levels here were approximately 2 meters above mean sea level, and although protected by barrier islands like Assateague and Chincoteague Islands, wind waves were still significant enough to produce erosion around the wooden bulkhead and concrete rip-rap that protected the shoreline in this location. The blue building is owned by the Chincoteague Bay Field Station and was a former NOAA research station. After Hurricane Sandy’s erosion completely exposed the septic tank, the facility is no longer able to be used and has no electricity or running water. The view is westward toward the little village of Greenbackville seen in the distance.
Credit: Sean Cornell
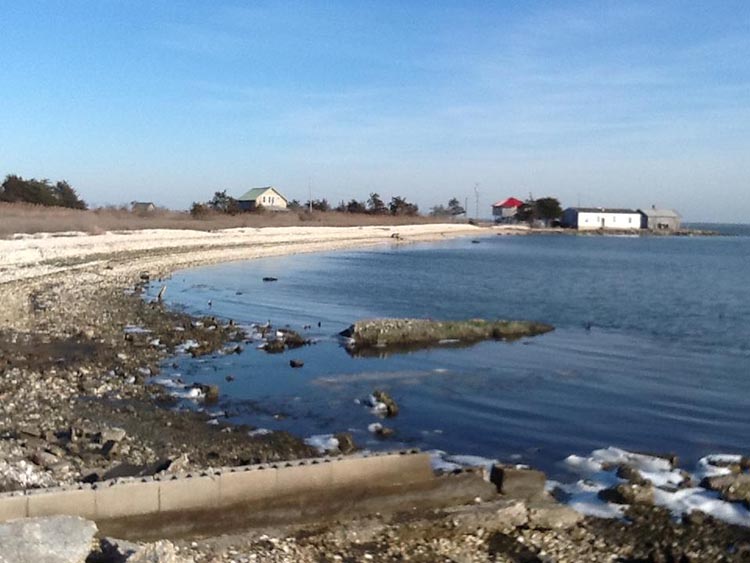
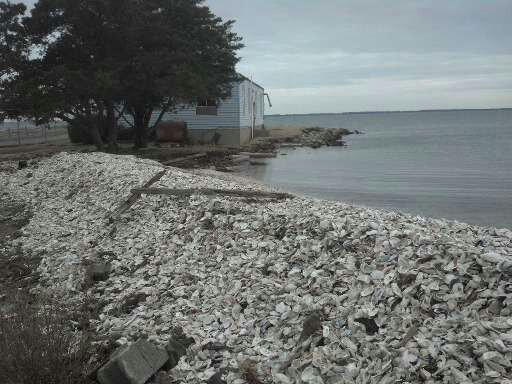
View northeastward onto Chincoteague Bay and toward Assateague Island from Franklin City, Virginia. Previous efforts to help stabilize the shoreline through the use of riprap and old building materials (a very common practice used historically) were in vain. Hurricane Sandy, combined with the impacts of Hurricane Irene two years earlier, resulted in erosion and retreat of the shoreline. In some places, as much as 14’ of erosion occurred along this length of shoreline. Where the shoreline was piled up with oyster shells, the erosion rate was significantly lower at around 4’ compared to riprap areas. So, although the erosion still took place, oyster-protected shorelines are usually subject to less erosion.
Credit: Sean Cornell
Four-foot high shell bank produced by Hurricane Sandy’s waves as the shells were reworked from the shallow bay. Most of these shells were deposited back in the bay after they were shucked in the shucking houses that once lined the shores of Franklin City, Virginia.
Credit: Sean Cornell
Hurricane Sandy
In contrast, and although Hurricane Sandy was similarly scaled in wind speed and size to Irene, ultimately it was much more impactful further north to New York and New Jersey primarily because of the storm track it took and the orientation of the shoreline where the storm made landfall. The figure below shows the storm track for Sandy in the fall of 2012. Whereas Irene’s track was parallel to the shore, Sandy’s approach was more perpendicular with landfall approach toward the northwest. In this way, not only was the brunt of the storm’s energy focused on the shoreline, but the geomorphic configuration of the shoreline and the shallow nature of the inner shelf led to amplification of the storm surge as outlined in the previous module.
Hurricane Sandy’s storm trackway from NOAA’s Historical Storm Track database. As the storm crossed the shelf-slope break, it downgraded from a Category 2 hurricane to a Category 1 hurricane and even degraded to a tropical storm before it came ashore. However, because of its trajectory at nearly a right angle to the shoreline, the full fury of the storm was released on the shoreline of New Jersey and New York. The wedge-shaped shoreline entering the Hudson River Embayment helped to funnel the waters into the embayment leading to higher and higher storm surge levels.