
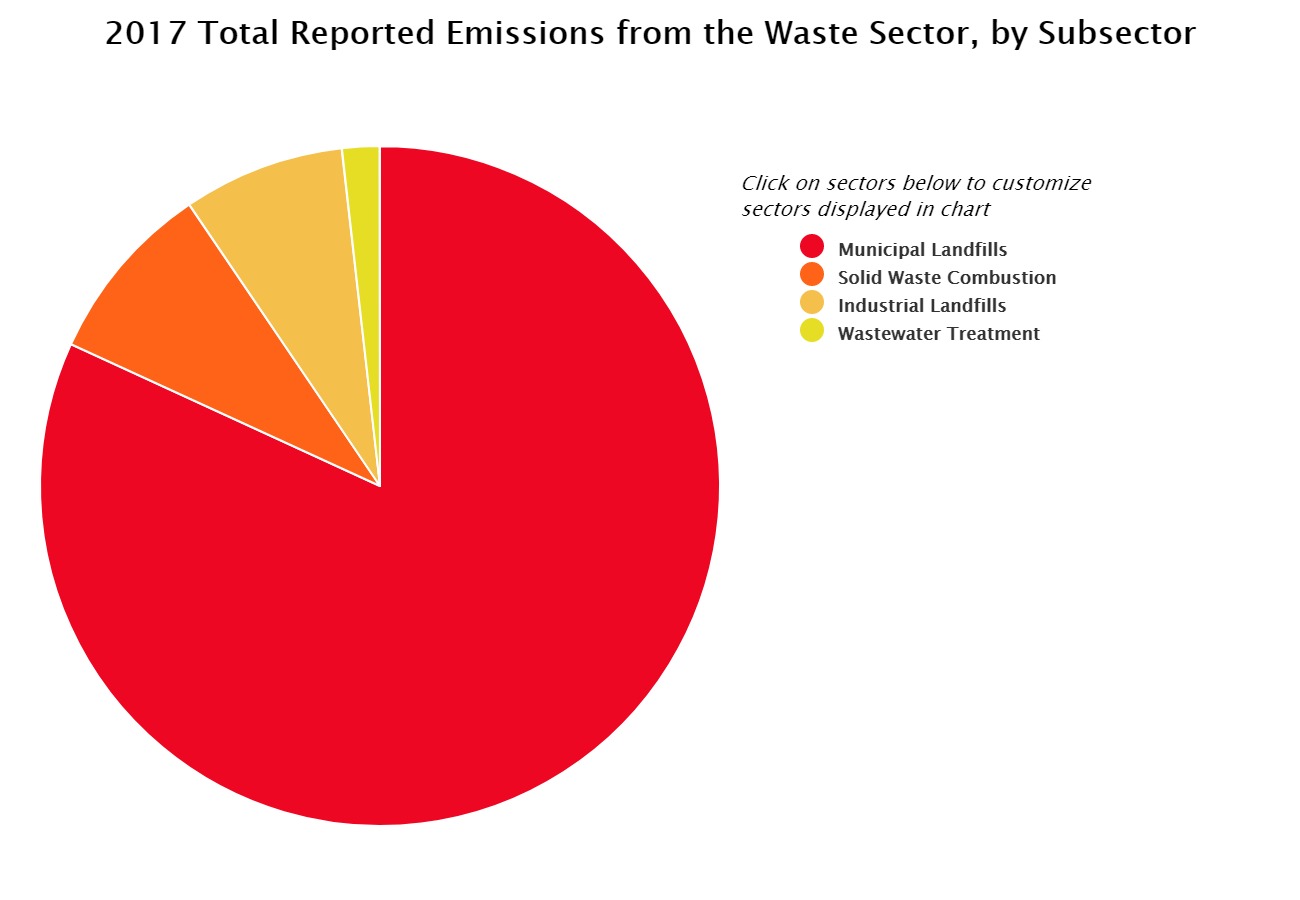
Let's take a quick look at the emissions from our waste sector. Generally, we can break these down into four categories for direct emissions from waste:
- municipal landfills (81.9%)
- solid waste combustion (8.7%)
- industrial landfills (7.7%)
- wastewater treatment (1.8%)
Remember, these are just direct emissions from waste - so what you don't see captured here are the emissions from hauling waste to landfills, or collecting it from your front yard or the dumpster behind your apartment. Those are indirect emissions.
Since municipal landfills represent such an enormous piece of the waste sector pie, let's focus on what that looks like (so we can start thinking about what we might be able to do about it).
When we send our trash to the landfill, there's a fair bit of organic matter in the mix - things like food waste and yard waste. This organic matter will decompose anaerobically and release methane. Much like the lagoon covers we just talked about earlier in this lesson, there are a few options for what we can do to minimize those emissions. We can flare the gas, or the landfill can harness the gas and either use it on site or sell it back to the grid. But beyond that, we can work do divert that organic matter from ever reaching the landfill in the first place. Composting food waste and yard waste is a great place to start! Does your community offer organic waste collection or dropoff? You should check it out! Perhaps you can put your organics out for collection so even if you're not an aspiring backyard composter (I'm not), you can help keep it out of the landfill.
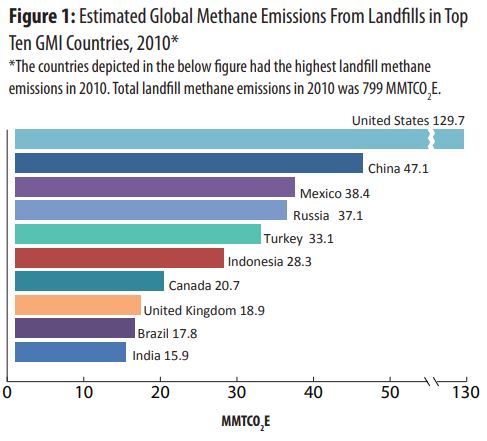
Take a close look at the biggest culprit of methane emissions from landfills on this bar graph from the Methane Landfill Initiative. This is 2010 data, so perhaps China is catching up to the US a bit, but for this snapshot in time, landfill emissions in the US were almost 3x that of the next closest country.
| Country | MMTCO2E |
|---|---|
| United States | 129.7 |
| China | 47.1 |
| Mexico | 38.4 |
| Russia | 37.1 |
| Turkey | 33.1 |
| Indonesia | 28.3 |
| Canada | 20.7 |
| United Kingdom | 18.9 |
| Brazil | 17.8 |
| India | 15.9 |
In the US, landfills over a certain size (containing 2.5 million metric tons of waste or 2.5 million cubic meters of waste) must capture their gas under Clean Air Act regulations. The EIA estimates that in 2017, about 370 landfills across the country were collecting their gas as part of this regulation (EIA, 2019). There are additional voluntary projects around the country as part of the Landfill Methane Outreach Program.