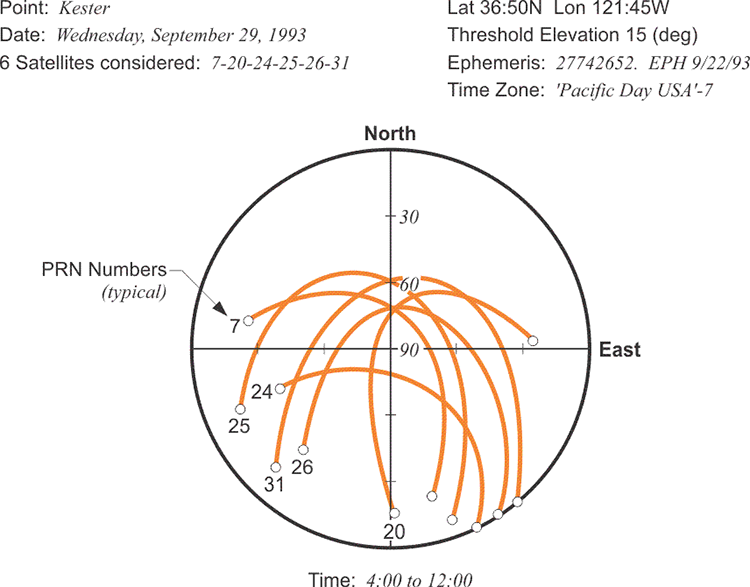
The position of the satellites above an observer’s horizon is a critical consideration in planning a GPS survey. So, most software packages provide various methods of illustrating the satellite configuration for a particular location over a specified period of time. For example, the configuration of the satellites over the entire span of the observation is important; as the satellites move, the DOP changes. Fortunately, the dilution of precision can be worked out in advance. DOP can be predicted. It depends on the orientation of the GPS satellites relative to the GPS receivers. And since most GPS software allow calculation of the satellite constellation from any given position and time, they can also provide the accompanying DOP factors. Another commonly used plot of the satellite’s tracks is constructed on a graphical representation of the half of the celestial sphere. The observer’s zenith is shown in the center and the horizon on the perimeter. The program usually draws arcs by connecting the points of the instantaneous azimuths and elevations of the satellites above a specified mask angle. These arcs then represent the paths of the available satellites over the period of time and the place specified by the user. The plot of the polar coordinates of the available satellites with respect to time and position is just one of several tables and graphs available to help the GPS user visualize the constellation.
It has become common to think that you can simply turn on a GPS receiver and start working under all circumstances. However, the position of the satellites in the sky is critical to good positioning. A polar plot, as illustrated here, shows you the paths of the satellites as if you were looking straight up.
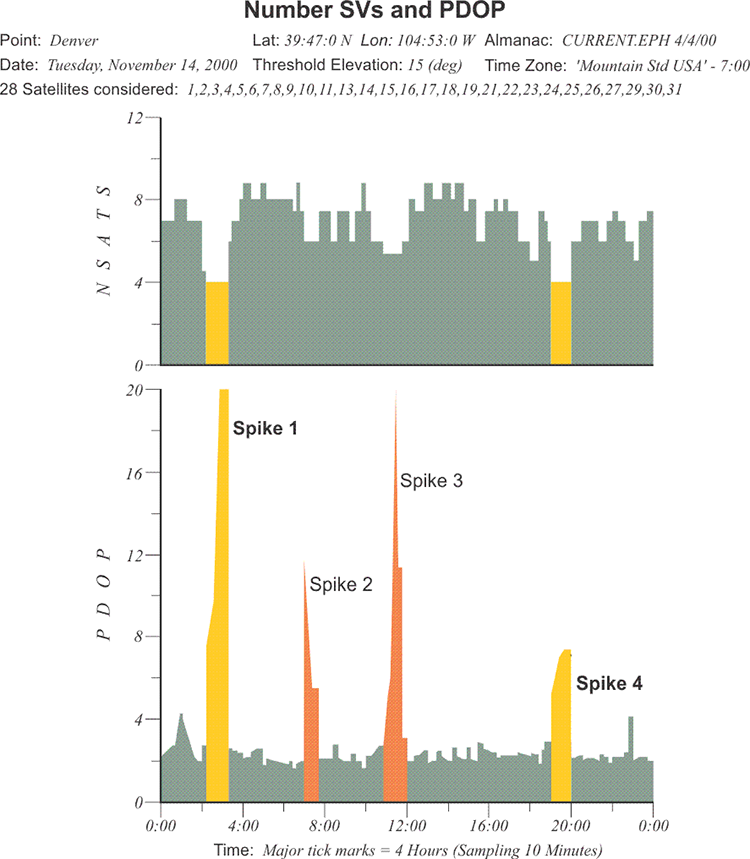
Another useful graph that is available from many software packages. It shows the correlation between the number of satellites above a specified mask angle and the associated PDOP for a particular location during a particular span of time.
There are four spikes of unacceptable PDOP, labeled here for convenience. It might appear at first glance that these spikes are directly attributable to the drop in the number of available satellites. However, please note that while spikes 1 and 4 do indeed occur during periods of 4 satellite data, spikes 2 and 3 are during periods when there are 7 and 5 satellites available, respectively. It is not the number of satellites above the horizon that determine the quality of GPS positions, one must also look at their position relative to the observer, the DOP, among other things. The variety of the tools to help the observer predict satellite visibility underlines the importance of their configuration to successful positioning.
The number of satellites is in the upper part of the chart. The PDOP, position dilution of precision, is in the lower part. Spikes one, two, three and four are areas of very large PDOP. During these moments, the positions that are collected are suspect. Starting at zero hour, the satellites vary between seven and eight, some of them begin to set at two hours. The constellation drops down to four satellites. The four that remain are crowded into one part of the sky. There's a rather extraordinary spike in the PDOP at that point. You wouldn't want to be observing at that time. Shortly thereafter, some satellites rise and the constellation goes back to eight and nine satellites; the PDOP drops below four, and that is a good time to observe.
However, even when there appear to be many satellites above the observer's horizon, there are more spikes in the PDOP. You may wonder why there are spikes if there are so many satellites. It is because the satellites are always moving relative to each other. And even though there are many, they can be crowded together and the PDOP high. At about 12 hours and moving on, the circumstances for observation are good. There are many satellites, the constellation is healthy, above the horizon, and the PDOP is low. However, between 18 and 20 hours, there are just four satellites again, and there is a spike in the PDOP.
So, as you see, it's not really straightforward. The PDOP can be high at any time. It is not correct to say that when the constellation above the horizon is large, the PDOP will be low. It is important to look at it in some detail. It's valuable to note that most processing software packages allow you to easily to make graphs of this type shown here if you have a current ephemeris in your system. And it's lucky that those current ephemerides can be downloaded from the Internet as well as collected from the satellites.