Prioritize...
When you've finished this section, you should be able to describe the main steering factors for tropical cyclones, including the role of subtropical highs. You should also be able to interpret the tropical cyclone "forecast cone of uncertainty" from the National Hurricane Center.
Read...
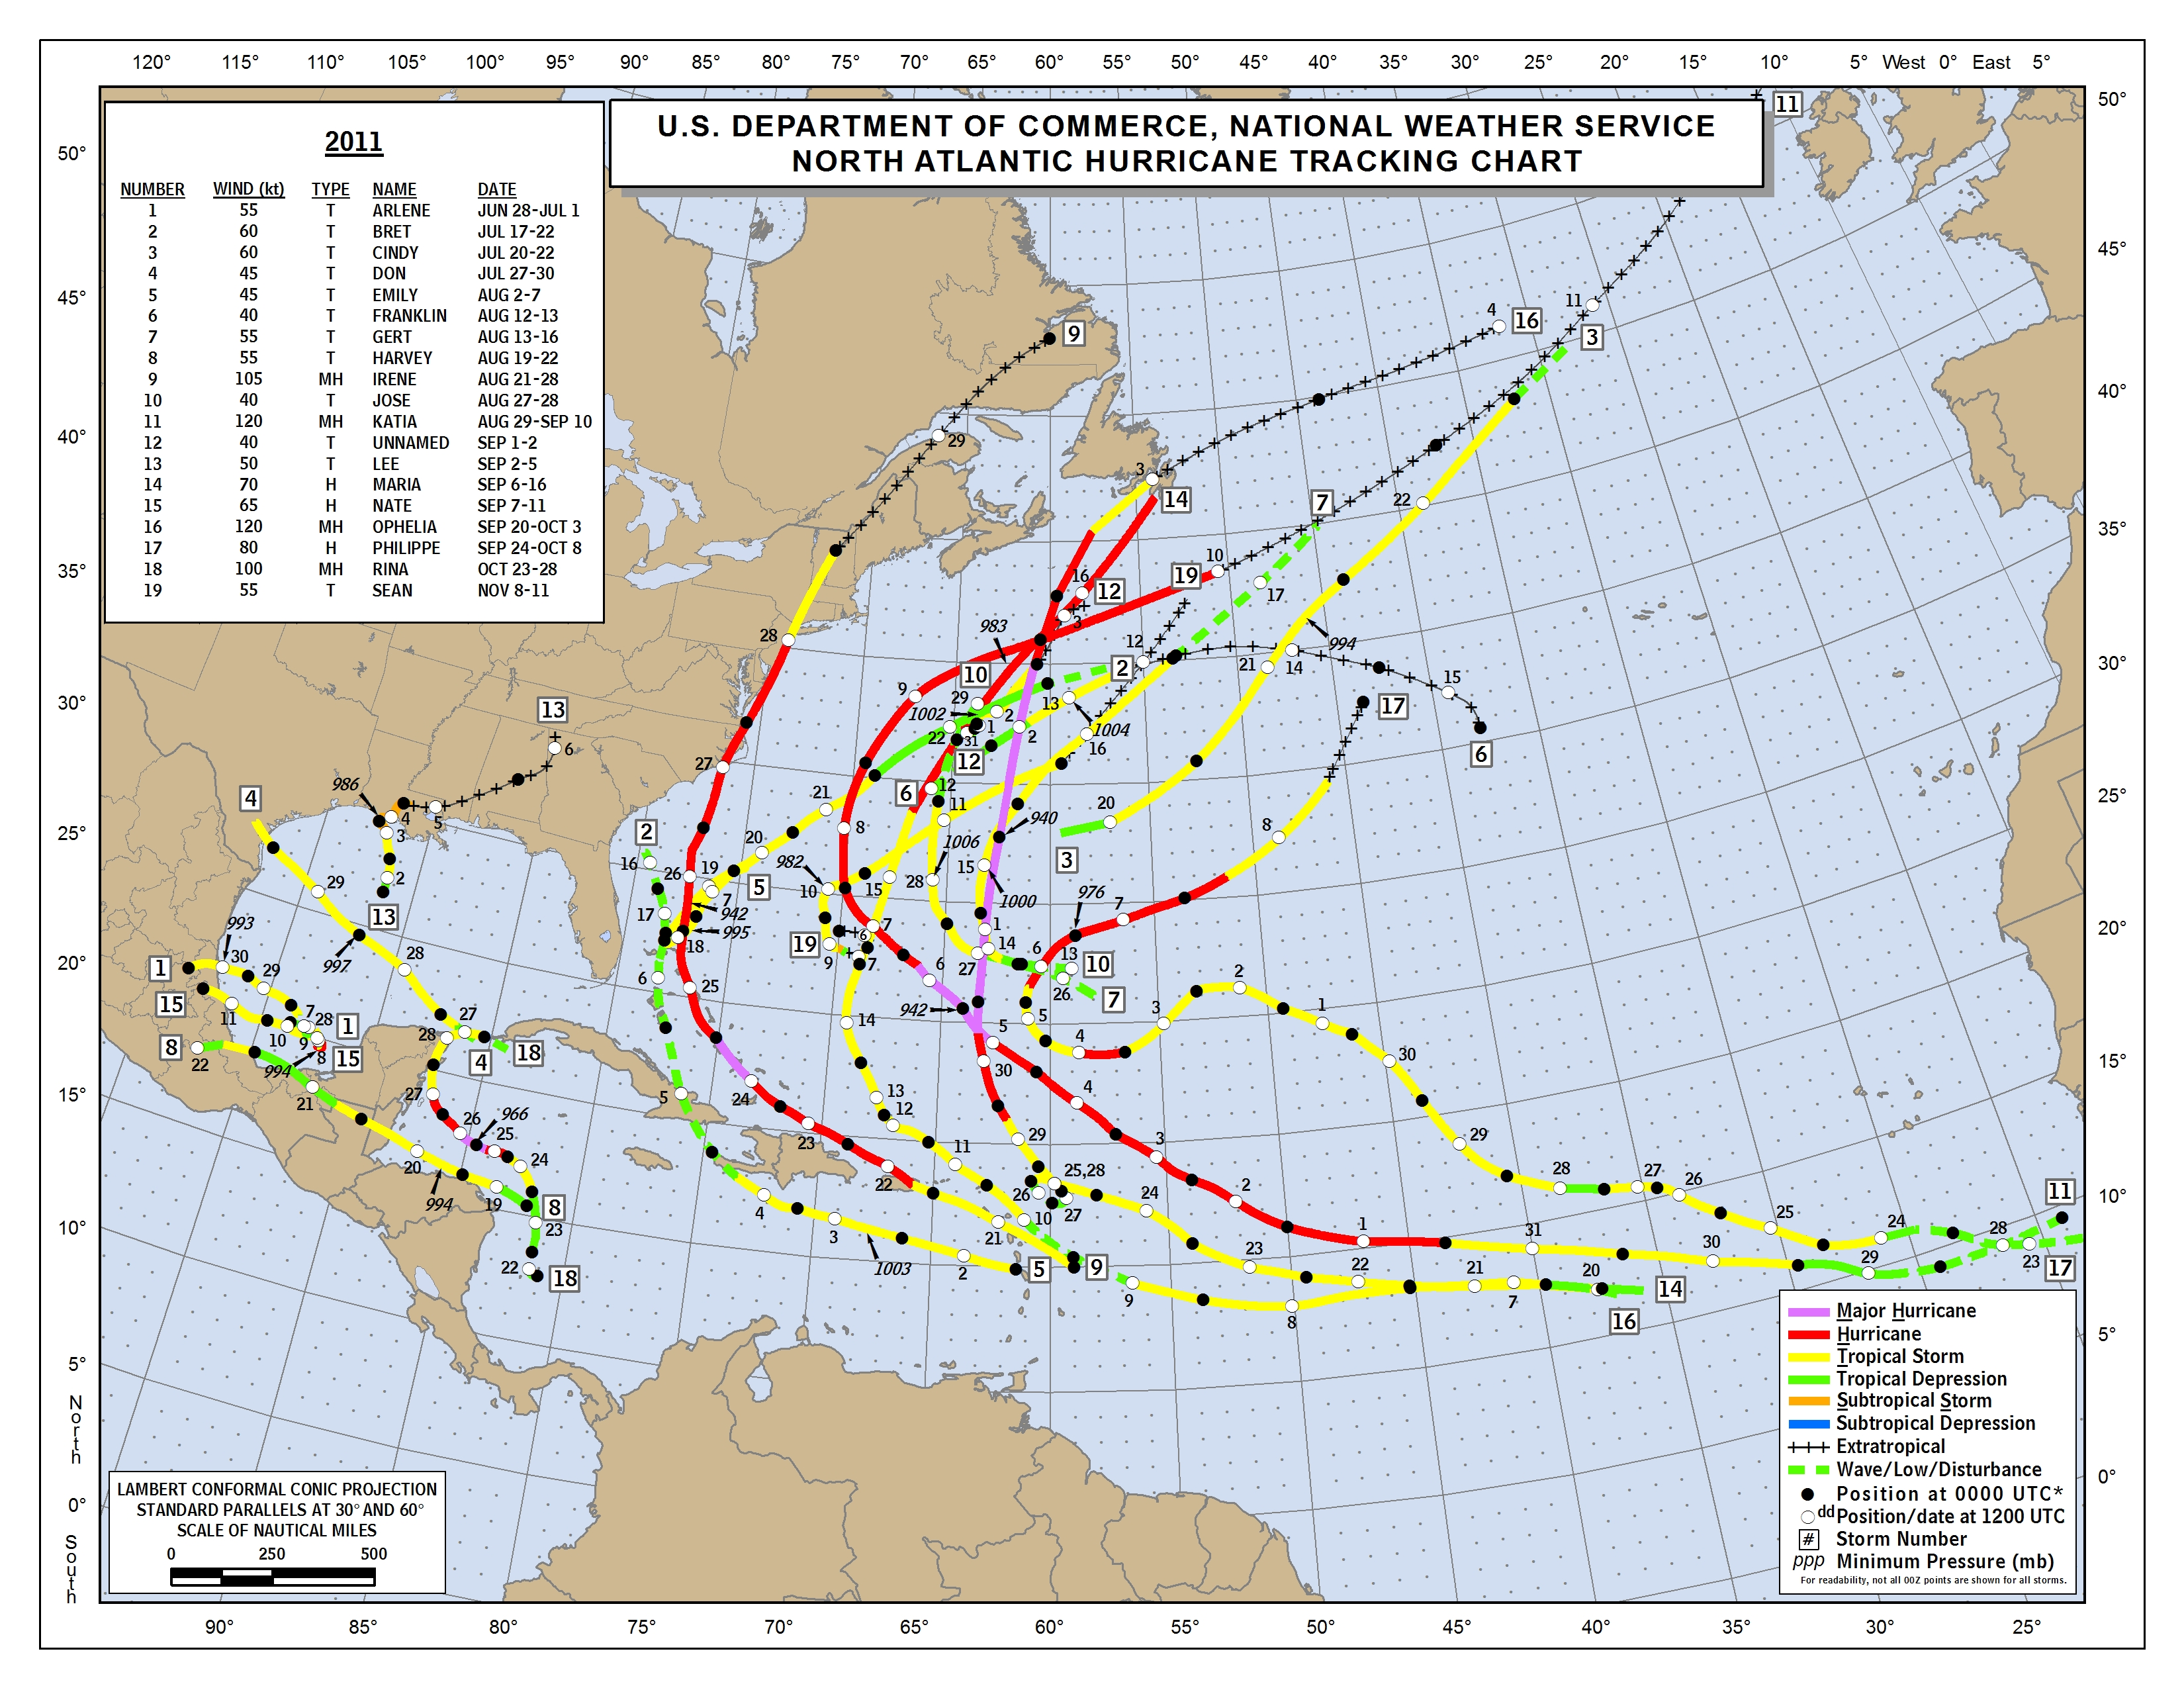
If you look at a seasonal track map from an Atlantic hurricane season containing several storms that trekked across the Atlantic from Africa toward North America, you'll note a common theme to many of the tropical cyclone tracks. To see an example, take a look at the track map for the 2011 Atlantic hurricane season. The gracefully clockwise-curving tracks of many storms in the Atlantic mirror the broad clockwise circulation of the Bermuda High. That's not a coincidence! Generally speaking, subtropical high-pressure systems (which you learned about previously) provide the mid-tropospheric steering winds for many tropical cyclones. Indeed, their clockwise curving tracks coincide with the clockwise circulation associated with the Atlantic subtropical high, as indicated by the schematic below.
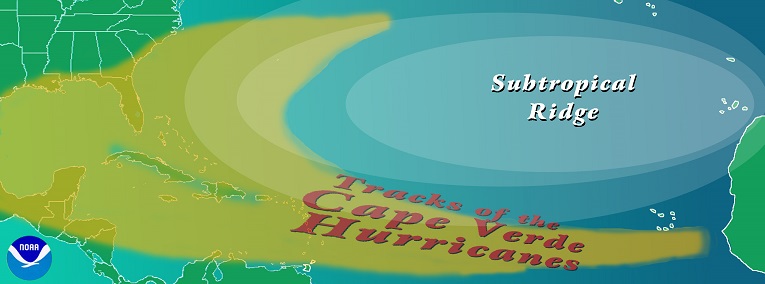
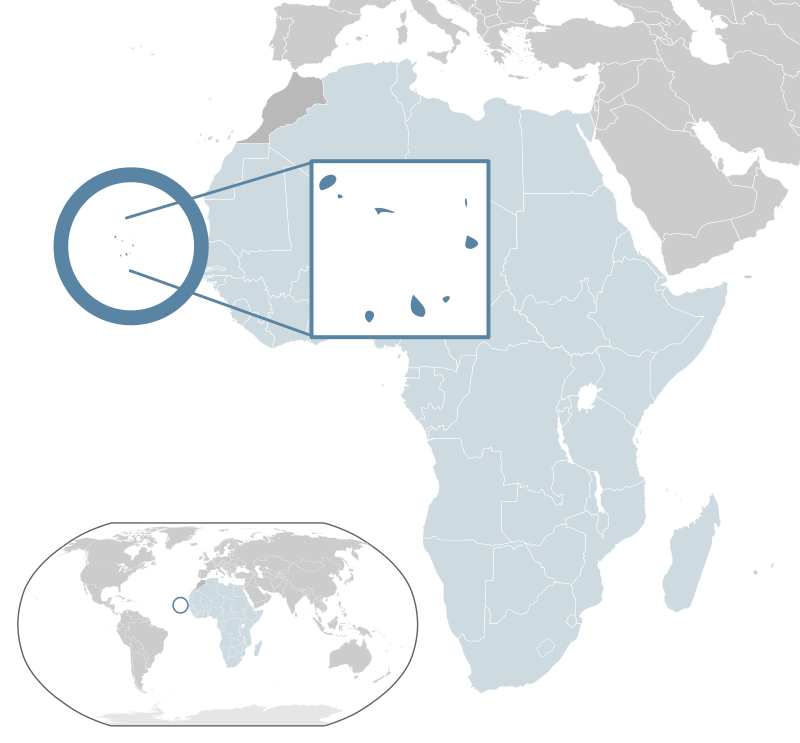
For the record, tropical cyclones that make the long trek across the Atlantic are often called "Cape Verde storms" because they often form within 1000 kilometers of the former Cape Verde Islands off the west coast of Africa. In 2013, these islands formally changed their name to the Cabo Verde Islands, but the name "Cape Verde storm" still lives on in meteorological circles. Old habits die hard!
While the mid-tropospheric winds around subtropical high-pressure systems play an important role in the steering of tropical cyclones (especially Cape Verde storms), they're not the only features that steer tropical cyclones. If only it were that simple! Indeed, when tropical cyclones head toward the middle latitudes, mid-latitude weather systems (particularly upper-level troughs and ridges) can also steer tropical cyclones as they move poleward from the tropics. To further complicate matters, tropical cyclones can actually impact their own steering environments (especially when steering currents are weak) as well as the steering environments of other nearby tropical cyclones.
But, when it comes to forecasting the movement of tropical cyclones, years of experience and research have shown that the average winds in various atmospheric layers are the dominant steering forces for tropical cyclones. Research has shown that the relevant atmospheric "steering layer" for a given tropical cyclone depends on the intensity of the storm. And, while there seem to be slight differences between ocean basins, the following theme holds true everywhere: The depth of the steering layer for a tropical cyclone increases with increasing cyclone intensity. More specifically:
-
Weak tropical cyclones (tropical depressions and tropical storms) tend to move in concert with the mean wind in a relatively shallow steering layer residing in the lower half of the troposphere (roughly 5,000 to 18,000 feet is a good proxy).
-
Strong tropical cyclones (hurricanes) tend to move with the mean wind in a much deeper layer that spans most of the troposphere (forecasters commonly look at the layer between roughly 5,000 and 35,000 feet).
The main takeaway is that stronger tropical cyclones are steered by the mean winds through a deep layer of the troposphere, while weak tropical cyclones tend to be steered by the mean winds in a much shallower layer in the lower half of the troposphere. To see an example of how forecasters assess a tropical cyclone's steering environment, let's look at Hurricane Irene, which brushed the East Coast of the United States in 2011. Here's a plot of Irene's track, and at 12Z on August 24, 2011, Irene was moving northwestward through the Bahamas. At the time, Hurricane Irene’s minimum central pressure was 957 millibars, so it was a fairly intense tropical cyclone, which would have been largely steered by the mean winds through a deep layer of the troposphere. If we look at the analysis of deep-layer steering winds (average winds through a deep layer of the troposphere) below, the reasons for Irene's northwest movement at this time were pretty clear, if you account for the fact that Irene's own circulation leaves a footprint in the wind field right in the storm's vicinity.
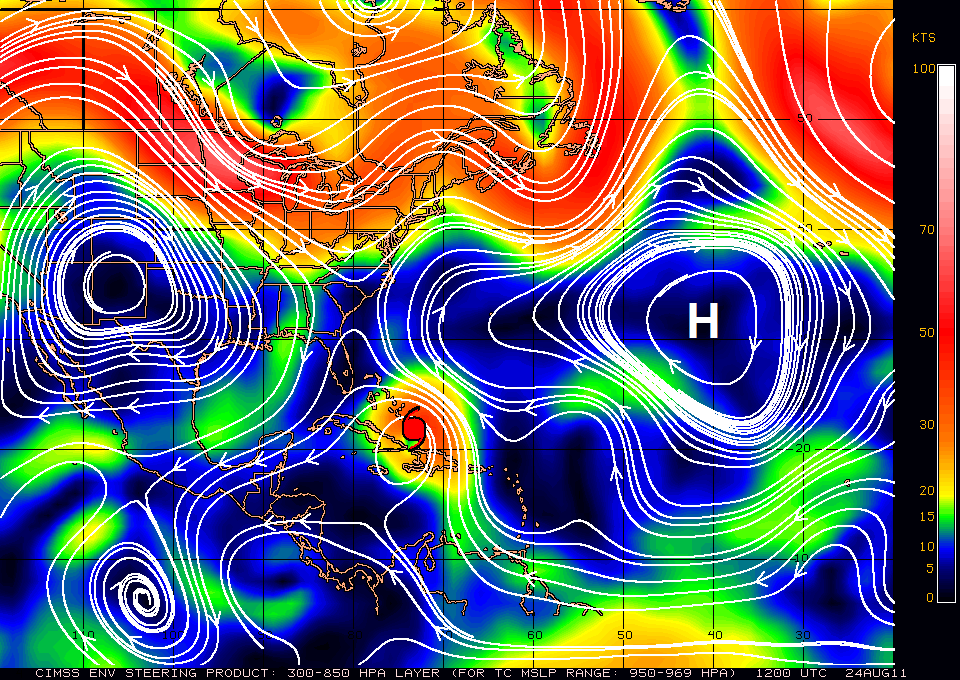
I've marked the center of the Bermuda High with a white "H", and the pattern of steering winds shows that Irene was following along with the clockwise flow around the high's periphery, as many Atlantic hurricanes do. But, sometimes assessing the steering environment for a tropical cyclone isn't so straightforward. Occasionally, steering winds are weak and don't provide a clear message about storm motion. In these cases, weak steering currents over the tropics, subtropics and middle latitudes can pave the way for slow, erratic movement of tropical cyclones (often a few knots or less), the details of which can be really hard to predict.
Tropical cyclones themselves actually account for some of the erratic drifts and turns in the tracks of slow-moving storms. While the physics of how tropical cyclones can alter their own steering environments is beyond the scope of this course, research has shown that this effect accounts for about 10 to 20 percent of a tropical cyclone's movement (the other 80 to 90 percent is controlled by mean winds in a specified steering layer, as I just discussed). These "storm-induced" steering forces are difficult to model as storms move and evolve, which makes forecasting in situations with weak steering winds particularly difficult.
Fortunately, steering winds are often robust enough to send a clear message about hurricane motion (at least for short term forecasts), and the average forward speed of tropical cyclones is about 15 knots (17 miles per hour). At the extreme, one legendary hurricane that raced along its path was the 1938 "Long Island Express." This storm made landfall as a Category-3 hurricane over Long Island, New York, and has been a subject of fascination ever since. The Long Island Express got its nickname because its forward speed approached 70 miles per hour as it streaked from 160 kilometers (100 miles) east of Cape Hatteras, North Carolina, at 7 A.M. on September 21, 1938, to Connecticut by 4 P.M. Although such a forward speed is exceptionally fast by hurricane standards, most tropical cyclones do speed up once they traverse into the middle latitudes because steering currents are often stronger there.
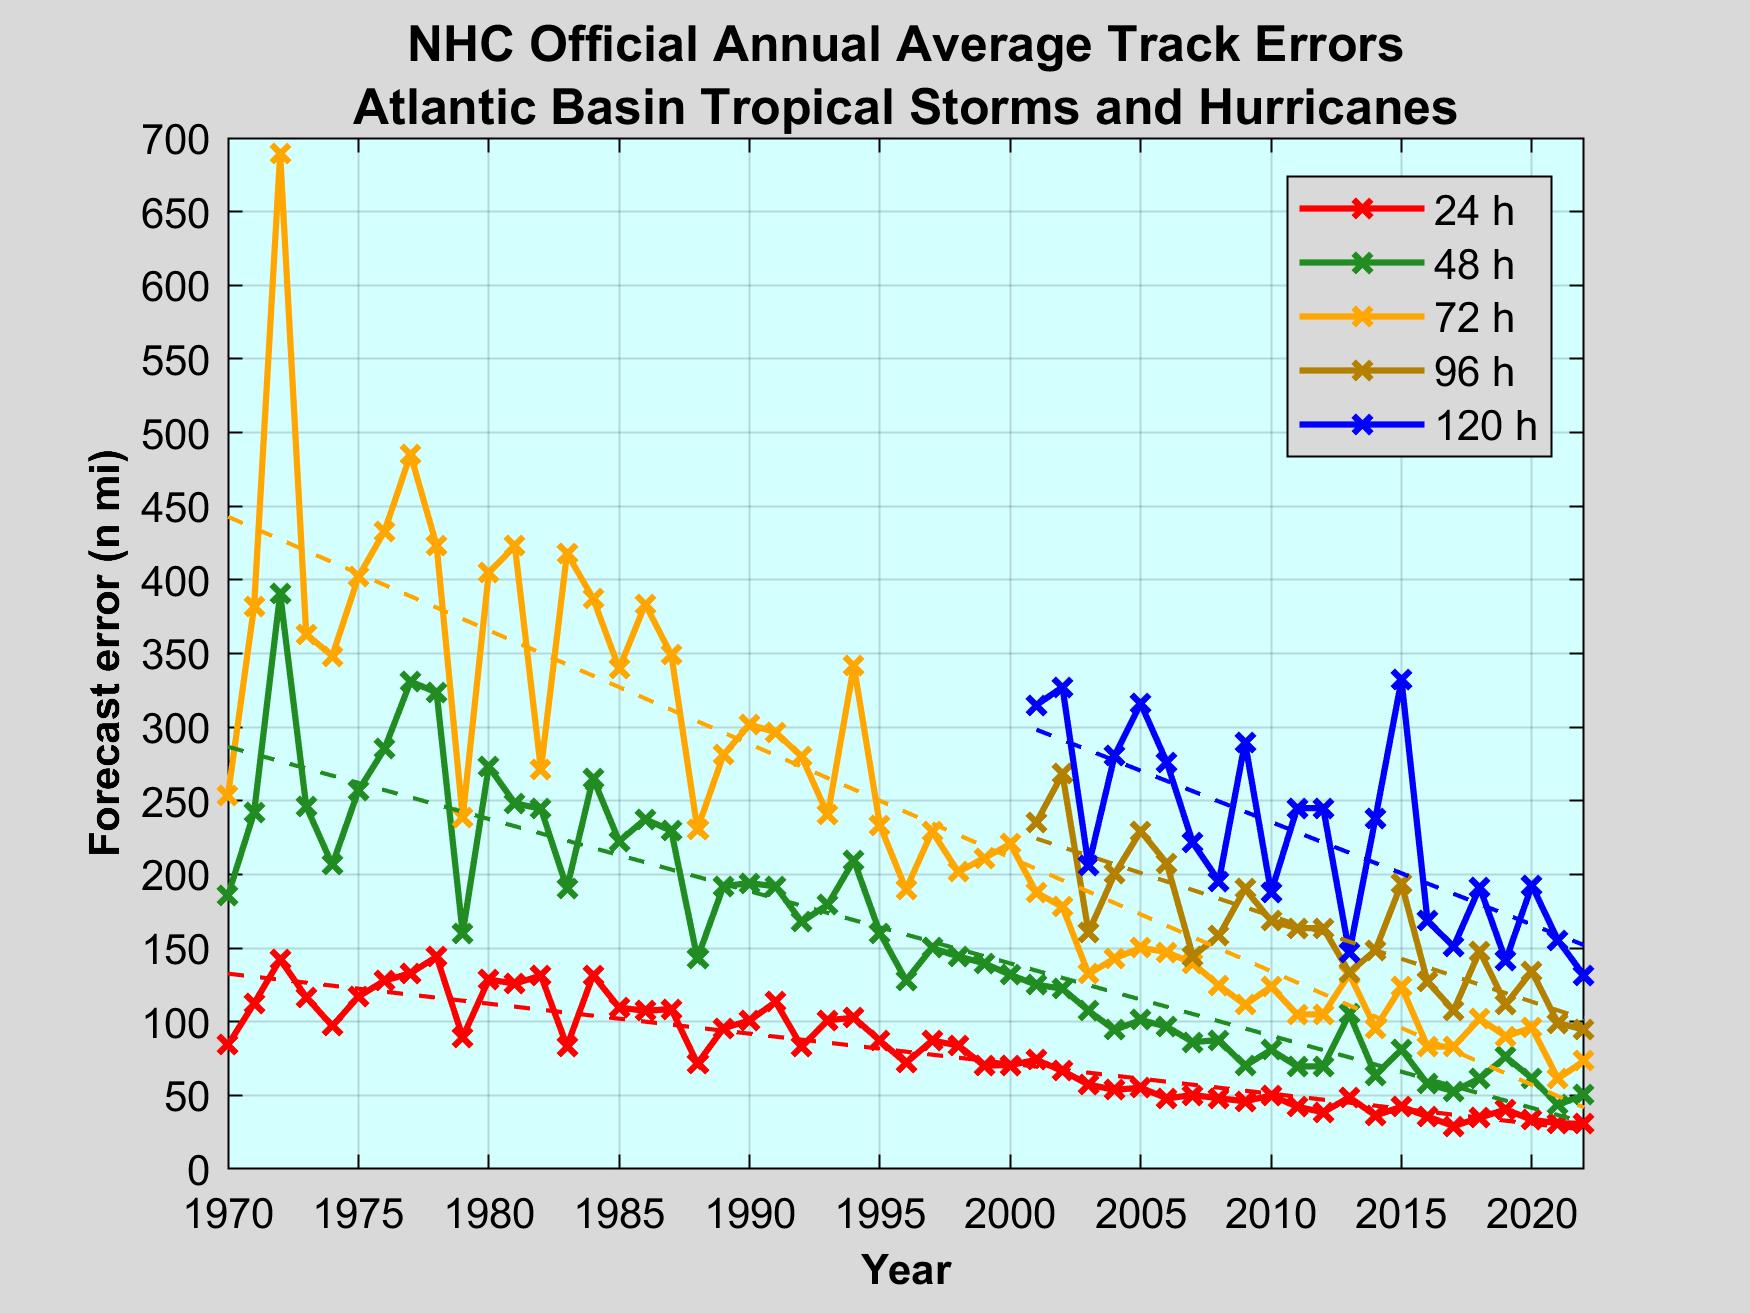
Even when a hurricane's track forecast appears rather straightforward, given the lack of upper-air observations and data over the tropical ocean basins, our ability to perfectly measure the steering environment over the oceans is imperfect; therefore, computer models that provide forecasters guidance for movement and intensity are flawed. Still, computer model guidance has improved over the years, resulting in better hurricane track forecasts, as shown on this graph of the average track forecast errors for National Hurricane Center forecasts of tropical storms and hurricanes since 1970. For the record, the National Hurricane Center is the branch of the National Weather Service responsible for providing tropical cyclone forecasts for 24 countries in the Americas and the Caribbean Islands, as well as maritime interests in the North Atlantic Ocean, Gulf of Mexico, Caribbean Sea, and Eastern Pacific (north of the Equator). A three-day forecast of a tropical cyclone's track from the National Hurricane Center today (average error less than 100 nautical miles) is more accurate, on average, than a one-day forecast was in the early 1970s!
Still, given our inability to perfectly measure the steering environments over data-sparse oceans, and the fact that tropical cyclones can modify their own steering environments (which is hard to model as storms move and evolve), hurricane track forecasts have uncertainties associated with them. To account for this, the most common presentation of forecasts for the track of a tropical cyclone's center are the National Hurricane Center's "cone of uncertainty." When a tropical cyclone threatens land, you'll find versions of their "cone of uncertainty" commonly on the Web and television news broadcasts. Below is the National Hurricane Center's "cone of uncertainty" for Hurricane Irma, issued at 5 A.M. EDT on September 7, 2017.
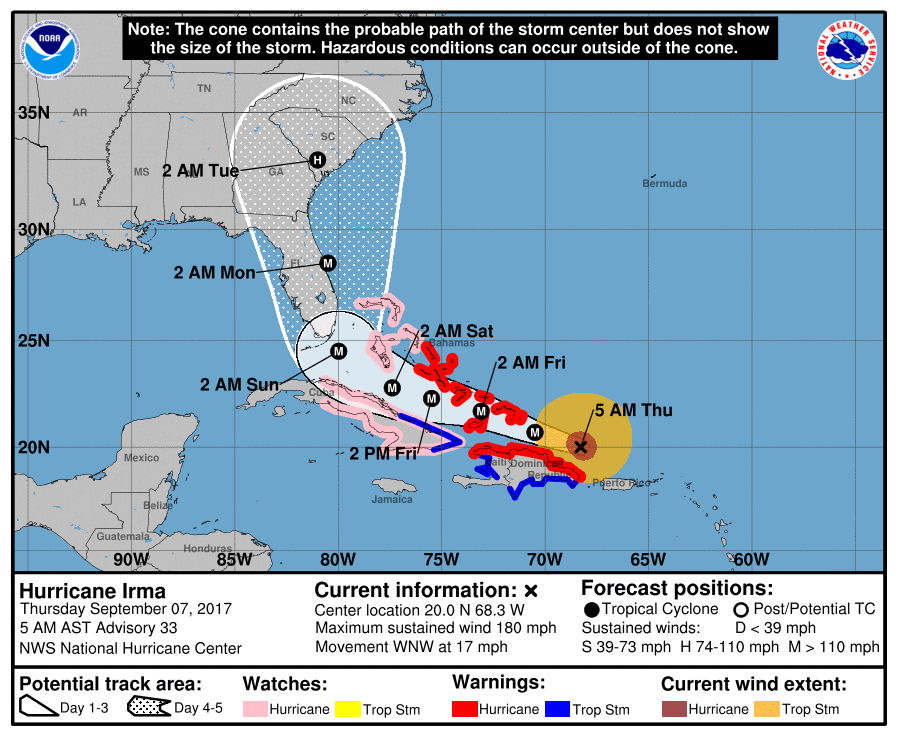
The position of Irma's center at the time the graphic was issued is marked by the black "X." The series of black dots indicate the successive predicted positions of Irma's center in the "official" National Hurricane Center Forecast. The letters within each dot indicate Irma's predicted intensity at each forecast time ("H" = Hurricane; "M" = Major Hurricane). The white shaded area reflects the cone of uncertainty through Day 3, while the cone for Days 4 and 5 is marked by the white-stippled area. Note how the cone of uncertainty widens with time, reflecting the growing uncertainty as forecast lead time increases.
The width of the cone is based on the National Hurricane Center's historical forecast errors for the previous five years, so the actual width of the cone changes a bit every year. To see what I mean, compare the width of the forecast cone for Hurricane Katrina in 2005 to how wide the cone would have been had Katrina occurred in 2015. The fact that the Katrina's cone would have been narrower had it occurred in 2015 reflects the average improvement in hurricane track forecasts.
Data suggest that the five-day path of a tropical cyclone's center will remain entirely within the five-day forecast cone approximately 60 to 70 percent of the time, which means that 30 to 40 percent of the time, a storm's center may travel outside the cone. Regardless, you should note hurricanes are not "points". They are storms with horizontal breadth, with wind fields that can span hundreds of miles. The forecast cone of uncertainty is based on probable paths of the center of the storm, and as a result, tropical-storm and hurricane conditions may occur outside the cone, even if the center of the storm always remains within the forecast cone of uncertainty. To help make that point, the National Hurricane Center includes a depiction of the current wind extent around the center of the storm (brown and orange shading show the extent of hurricane and tropical-storm force winds, respectively).
So, keep in mind that the forecast "cone of uncertainty" that you may see as a storm approaches land is meant to send the message that the storm's exact path is not certain. If you live in a tropical cyclone-prone area in or around North America, I urge you to keep tabs on National Hurricane Center official forecast products for updated forecasts. They can help you prepare for the many hazards that tropical cyclones may bring when they make landfall (and afterward), which we'll explore in the next section. Read on.