Prioritize...
Upon completing this section, you should be able to discuss the wind-related hazards (in the eye wall and spiral bands) and water-related hazards (storm surge and inland flooding) associated with tropical cyclones. You should also be able to identify which areas of a tropical cyclone are most prone to specific hazards.
Read...
As the "kings of all low-pressure systems," hurricanes can cause immense damage. Recall that the top of the list of costliest weather disasters in the United States is dominated by hurricanes. So, exactly what are the hazards associated with tropical cyclones? When it comes do diagnosing their hazards, the discussion basically comes down to two things -- wind and water. Let's investigate.
Wind-Related Hazards
Overall, the area of a tropical cyclone with the worst weather tends to be the eye wall. The eye wall of a hurricane or typhoon (especially a major hurricane or Super Typhoon) can be a really violent place, as evidenced by this chaser video of conditions in the eyewall of Super Typhoon Haiyan (2013) I referenced previously (it's worth a watch now if you didn't watch it before). The eye wall usually contains the fiercest winds in the storm, which is an important point to remember because the Saffir-Simpson Scale uses maximum sustained wind speed to classify hurricanes. Therefore, typically hurricanes are classified by the maximum sustained winds in the eye wall. So, if a hurricane is rated as a Category 4 storm on the Saffir-Simpson Scale, that means Category-4 sustained winds (130-156 miles per hour) are likely located somewhere in the eye wall.
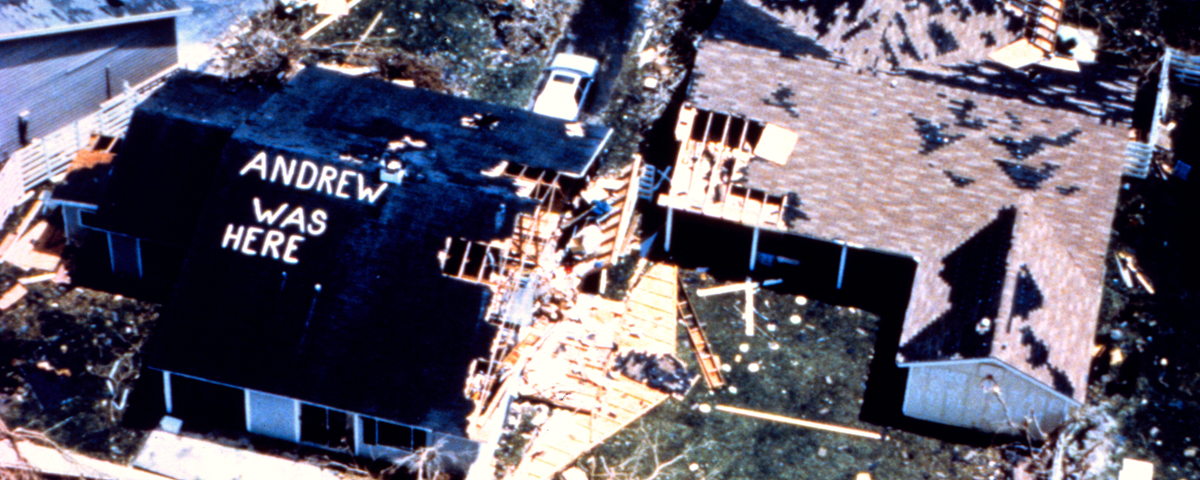
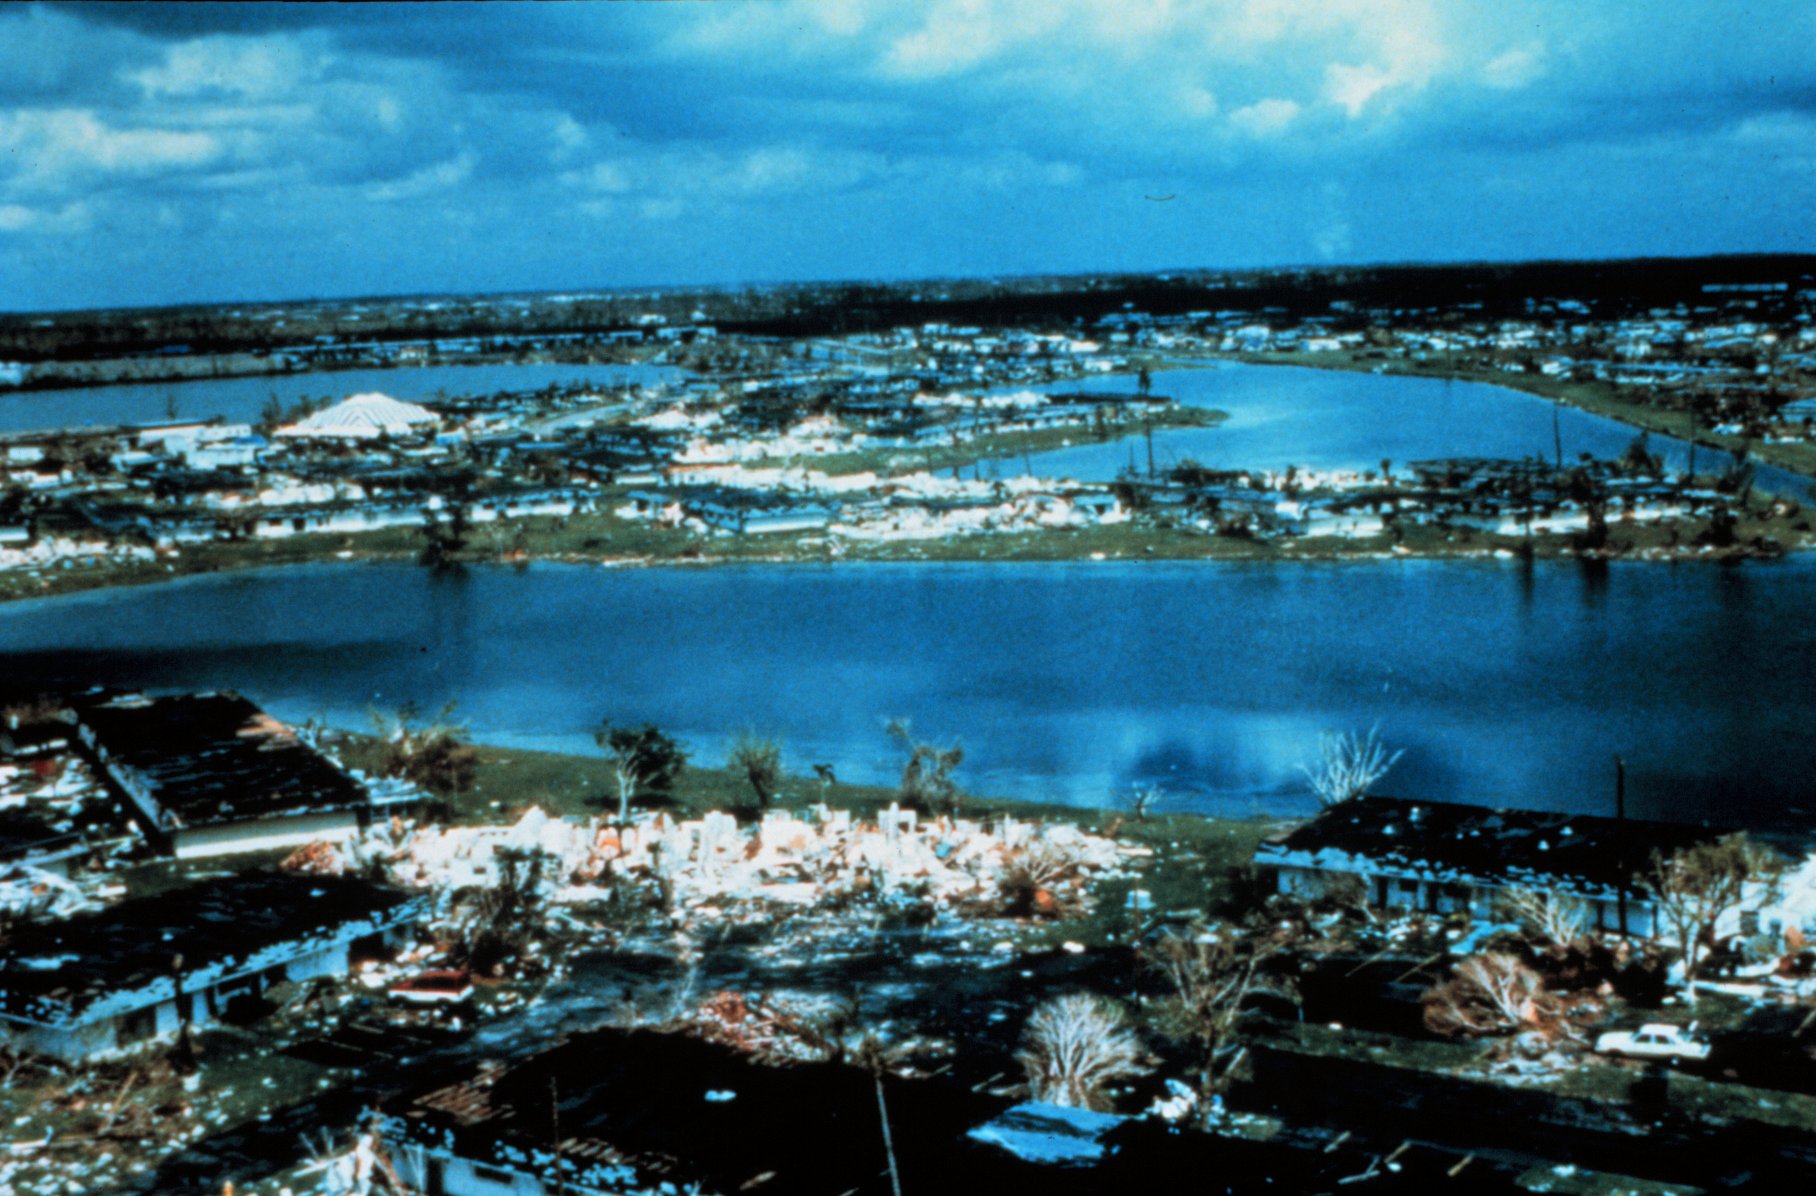
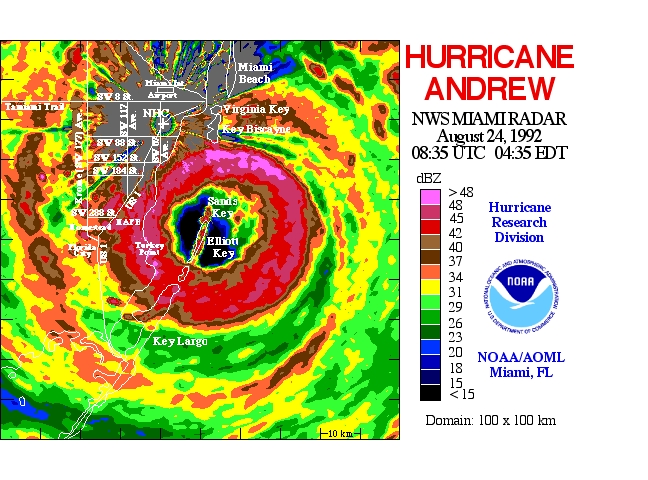
But, while only a small area experiences the maximum winds a storm produces, the wind damage in that area can be catastrophic. Hurricane Andrew (1992) is one of only a few Category 5 hurricanes on record to hit the United States, and provides a good example. Andrew's eye wall passed directly over Homestead, Florida (just south of Miami) and completely destroyed 99 percent of the mobile homes in town. Furthermore it stripped some frame-built houses right off their foundations. A 164-mile per hour wind gust was measured at the headquarters of the National Hurricane Center (located in nearby Coral Gables, Florida) before their wind-measuring equipment broke. Indeed, the damage from violent horizontal and vertical air motions in the eye wall looked much like that of a violent tornado.
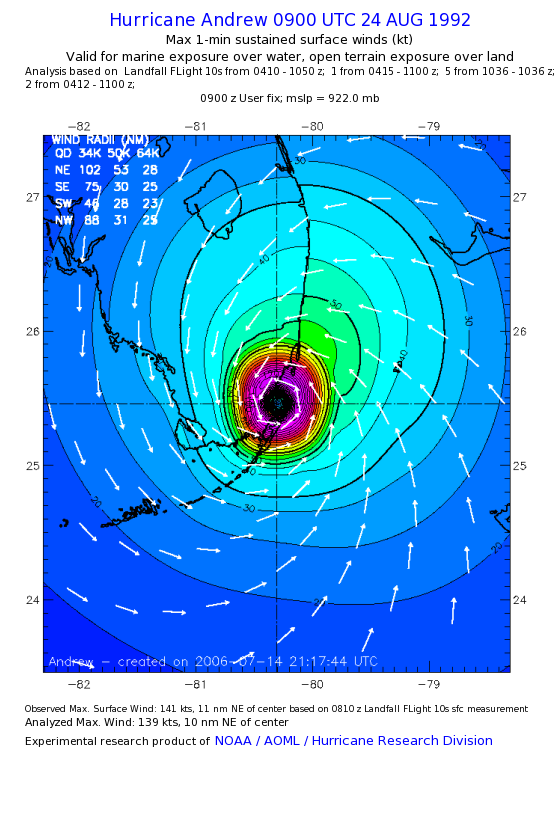
To get a feel for the size of the area impacted by Andrew's worst winds, check out this analysis of the storm's wind field from 09Z on August 24, 1992 (credit: Hurricane Research Division). The contours near the center of Andrew are hard to read, but the hurricane-force sustained winds (at least 64 knots, or 74 miles per hour) are confined to the ring of yellow and purple shadings immediately surrounding the eye. That area coincides with the ring of powerful thunderstorms in the eye wall, as seen on this radar image of Andrew as it made landfall (credit: Hurricane Research Division). So, the area that experienced the fastest sustained winds (100 miles per hour or more) was, indeed, pretty small (confined to roughly 10 to 15 miles from the center).
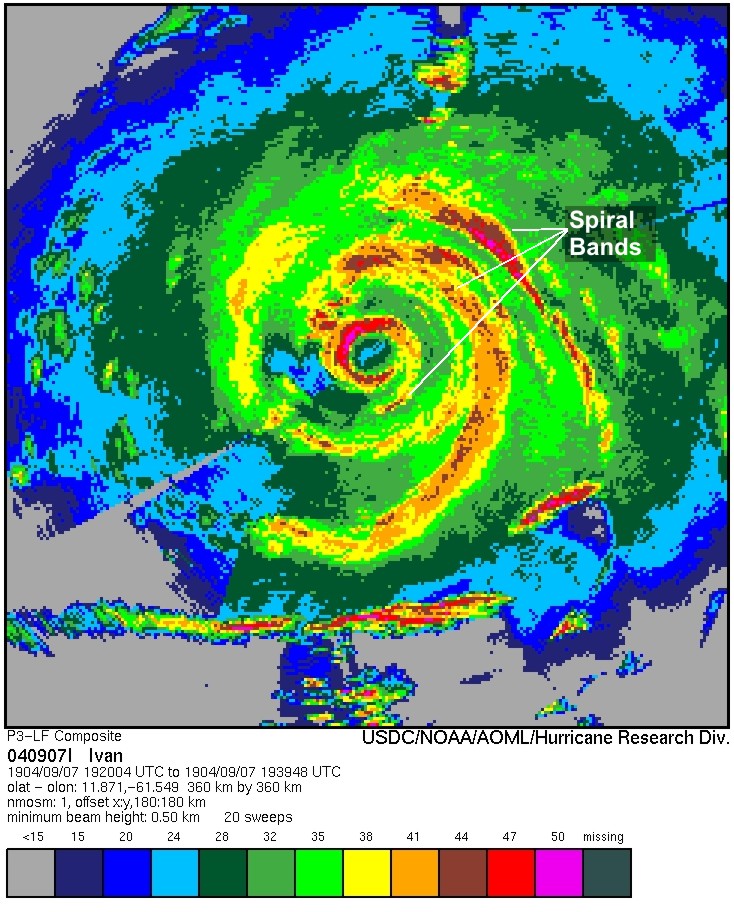
However, while the worst of the wind is typically located in the eye wall of a hurricane, the wind threats don't stop there. Indeed, squalls of heavy, fitful rains and strong gusty winds can occur relatively far from the center of the storm. These squalls, which form away from the eye wall, are called spiral bands. If you're wondering why they're called "spiral" bands, it's because they are relatively long, narrow curves of showers and thunderstorms oriented in the same direction as the wind, which spiral from the periphery of the storm inward toward the core region. This radar image of spiral bands in Hurricane Ivan (2004) is a good example (credit: Hurricane Research Division). The width of spiral bands can vary from five to 50 kilometers, accounting for the abrupt transitions from cloudy, breezy conditions to squally, fitful weather and then back to cloudy, breezy conditions as they pass.
Spiral bands can produce severe wind gusts capable of damage similar to that of a severe thunderstorm, and in stronger hurricanes, can produce wind gusts well over 75 miles per hour. But, damaging straight-line winds aren't the only threat in spiral bands. Meteorologists pay close attention to spiral bands because they play a pivotal role in spawning tornadoes during landfall. Tornado outbreaks are common with landfalling hurricanes (about half of all landfalling tropical cyclones spawn twisters), and most of the tornadoes form in the spiral bands away from the center of the storm.
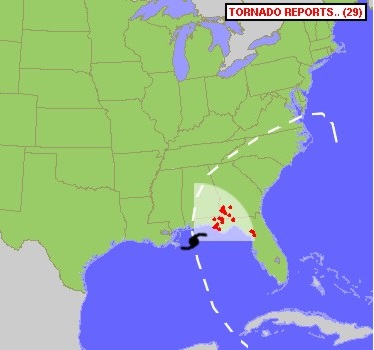
A good example of a tropical cyclone that was a prolific tornado producer as it made landfall was Hurricane Ivan (2004). The storm reports for September 15, 2004 from the Storm Prediction Center show that Ivan spawned 29 tornado reports in Florida and Georgia as it approached the coast. The tornado threat tends to diminish once the tropical cyclone weakens over land, but Ivan was a bit unusual in that it continued to spawn tornadoes well inland. Indeed, just a couple of days later on September 17, Ivan's remnants produced 59 tornado reports (37 of them in Virginia alone) as they moved northeastward over the Mid-Atlantic States.
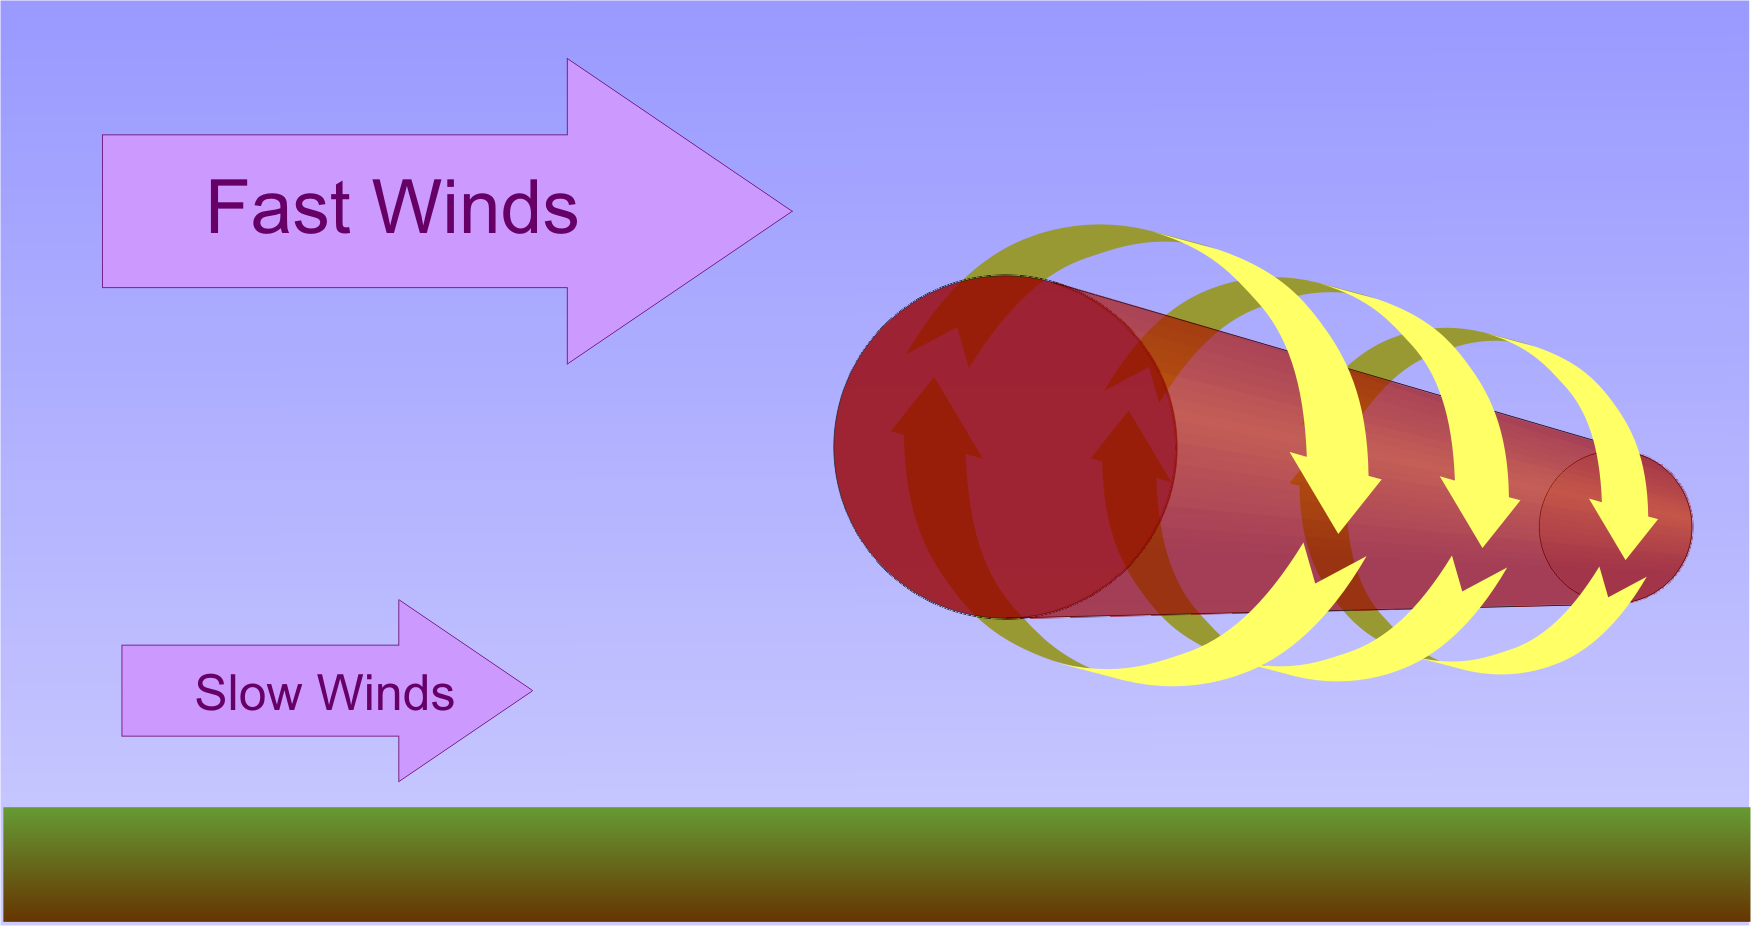
Research has shown that most tornadoes with landfalling tropical cyclones occur in the right-front quadrant of the storm (with respect to its direction of motion). For example, the 29 tornado reports in Florida and Georgia from Ivan's landfall all occurred in the storm's right-front quadrant (the storm was moving toward the north). Why the preference for the right-front quadrant? For starters, the forward speed of the hurricane adds marginally to the overall speed of the wind in the right-front quadrant (although the effect is greater if the storm is moving relatively quickly). Given that the rougher land exerts greater friction on lower-level winds, the environment in the right-front quadrant of landfalling hurricanes boasts very strong vertical wind shear in the lowest one kilometer or so. The strong vertical shear in the right-front quadrant tends to produce horizontal rolls (see schematic below). In areas where upward motion is strongest, horizontal rolls are then tilted vertically, setting the stage for supercell thunderstorms, which as you know, can spawn tornadoes.
I should point out that the supercells that form in spiral bands are small compared to the monsters that erupt over the Great Plains in spring. As a result, tornadoes that spin up in concert with landfalling hurricanes tend to be "mini tornadoes" (EF-0 or EF-1), and not "maxi tornadoes" (EF-4 or EF-5). Research also suggests that strong vertical shear through deeper layers tends to increase the number and intensity of hurricane-spawned tornadoes. Moreover, faster moving tropical cyclones tend to produces more tornadoes. Given the threat from tornadoes, the Storm Prediction Center often issues tornado watches for the right-front quadrant of all landfalling tropical cyclones, particularly where winds blow onshore within about 500 kilometers of the storm's center.
Water-Related Hazards
While hurricane winds often take the top headlines, the greatest threat to life and property from a hurricane often comes from water, namely storm surge and inland flooding. For the record, the storm surge is a dramatic rise in sea level, primarily as a result of fierce onshore winds pushing water toward shore, where it piles up and then surges inland. Battering waves atop the storm surge exacerbate the damage. The severity of the storm surge at any given location depends on the orientation of the coastline with respect to the storm's track, the intensity, size, and forward speed of the storm, and the layout of the ocean floor near the coast.
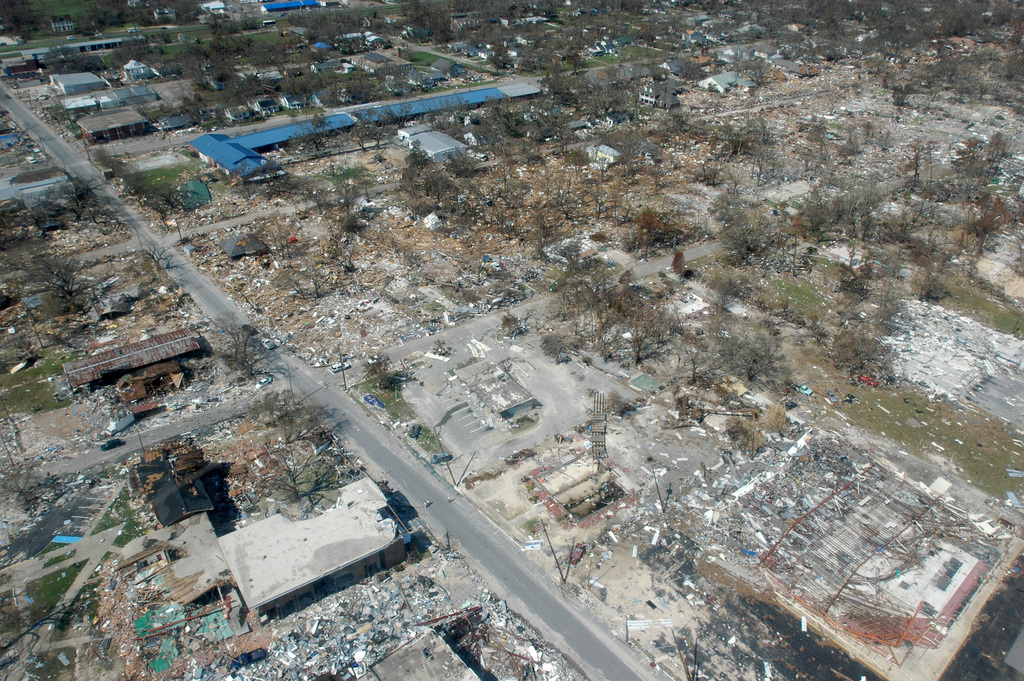
As an extreme example of the destruction that storm surge can bring, check out this photograph of damage in Gulfport, Mississippi (credit: FEMA / Mark Wolfe) from Hurricane Katrina (2005). The storm surge in parts of Gulfport reached levels nearly 30 feet high, which was more than enough to completely destroy many buildings along the coast. For a first-hand look at the dangers of storm surge, I recommend this video taken in Gulfport on the day that Katrina made landfall (it's worth a look if you didn't watch it when I referenced it at the beginning of the lesson). The greatest threat from storm surge often occurs in the right-front quadrant as a storm makes landfall, where onshore winds are the strongest and can most effectively push ocean water onshore.
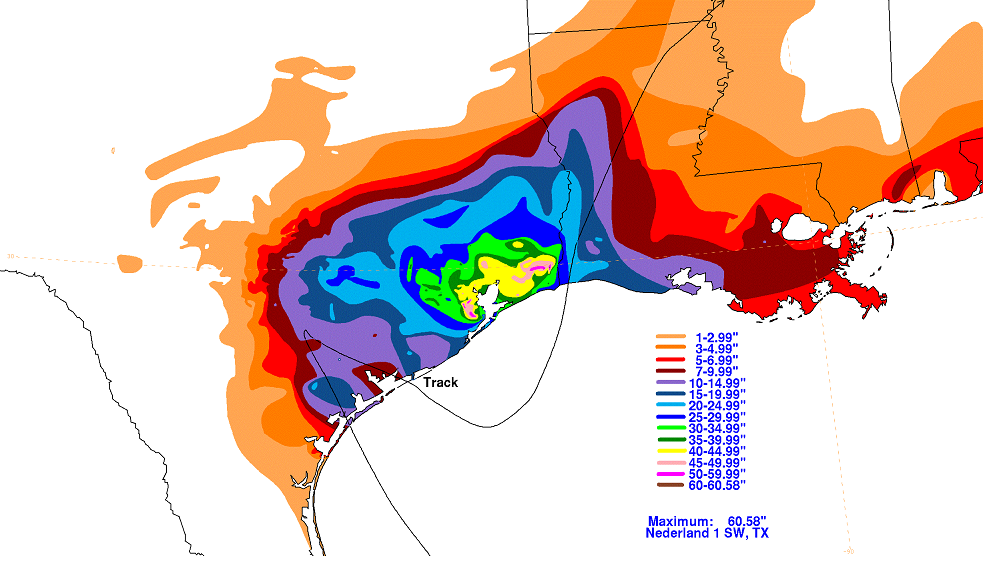
But, storm surge isn't the only water-related threat associated with tropical cyclones. Another water-related hazard exists well inland after a tropical cyclone makes landfall -- flooding from persistent heavy rain. Perhaps the best example of flooding from a tropical cyclone's heavy rainfall is from Hurricane Harvey (2017). Harvey made landfall near Corpus Christi, Texas on August 25, 2017 as a Category 4 hurricane, but stalled and meandered over southeast Texas. Several days of relentless heavy rain in the Houston and Beaumont areas led to unprecedented flooding. As shown in the rainfall analysis below, as much as 40 to 60 inches of rain fell in parts of southeast Texas, causing widespread, catastrophic flooding (check out a photo gallery from the National Weather Service).
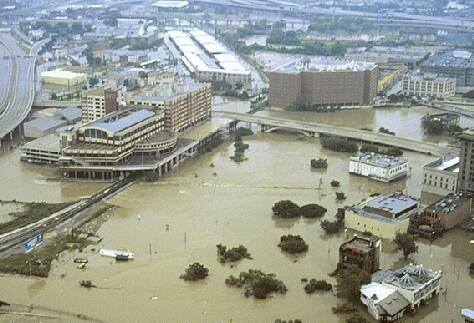
But, don't fall into the trap of automatically assuming that only the strongest tropical cyclones (hurricanes and typhoons) cause serious inland flooding. Between June 5, 2001 and June 9, 2001, Tropical Storm Allison approached, made landfall, and lingered over eastern Texas as a tropical depression. During that time, sections of Harris County (which contains Houston), received over 35 inches of rain (credit: National Weather Service) and that's from a storm that was never a hurricane. Despite the fact that Allison was "only" a tropical storm, its impacts were devastating (credit: NOAA photo library). Whenever a tropical cyclone moves slowly, the risks for flooding increase. The flooding risk also increases if the storm makes landfall in a mountainous area, as orographic lifting can increase rainfall totals and runoff, and / or if conditions have been wet previously, leading to wet soil and high water levels in rivers, streams, lakes, etc., even before the rain associated with a tropical cyclone arrives.
Given the dangers posed by water in tropical cyclones, does classifying storms using the Saffir-Simpson Scale (which is based solely on maximum sustained winds) adequately communicate the threats posed by an approaching hurricane? We'll discuss that topic in the next section.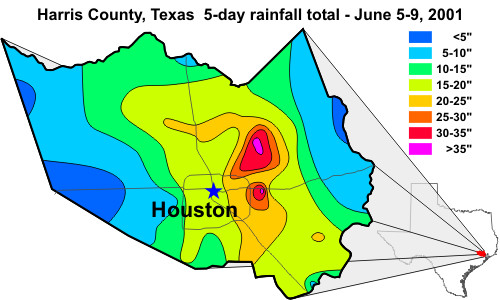