Ancient Climate Events: Pleistocene Glaciation
Some of the most abrupt and dramatic climate changes occurred very recently in Earth’s past, a geologic heartbeat ago if we consider the complete 4.6 billion years of the planet’s history. Materials including sediments deposited in the deep sea, ice formed in massive glaciers, stalactites formed in caves, wooly mammoths, and other large mammals, and spores and pollen of plants, provide evidence for very large and frequent oscillations in Earth’s climate that began about 2.5 million years ago. These oscillations involve the repeated advance and retreat of glaciers in the Northern Hemisphere. At their peak, ice-covered the northern parts of North America, Europe, and Asia, and the climate fluctuations also caused major changes in vegetation and animal habitats, as well as significant changes in ocean circulation.
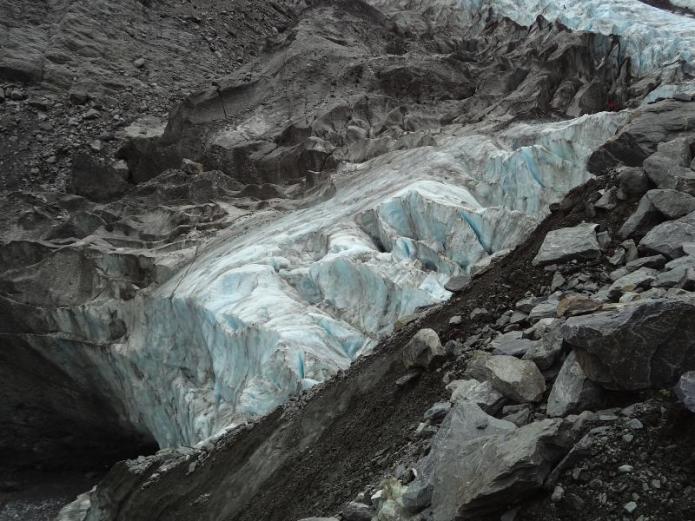
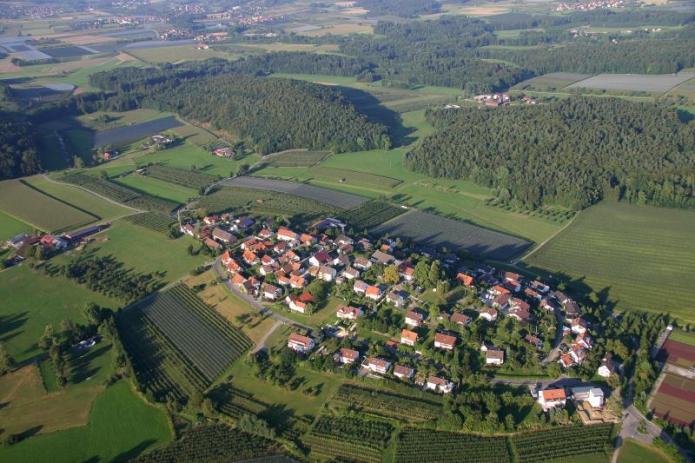
Glaciers deposit very diagnostic landforms and sediments that are often full of large boulders eroded from wide swaths of land over which the ice has traveled. More than a century ago, geologists determined using such evidence that at the coldest time of the Pleistocene, glaciers covered Edinburgh, Scotland; Moscow, Russia; and Detroit and Chicago in the US. In fact, from the glacial deposits alone, glaciologists had inferred several major advances and retreats of the two major ice sheets, the Laurentide in North America and the Fennoscandian in Europe and Asia.
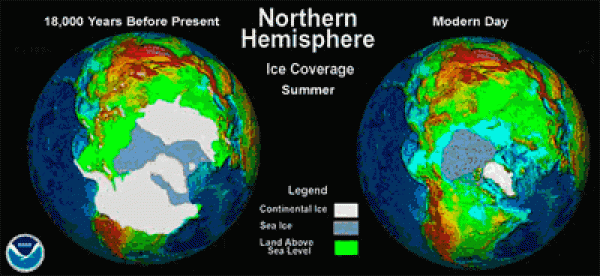
At the height of the last major glaciation, known as the Last Glacial Maximum (LGM),18,000 years before the present, ice sheets covered Chicago, Boston, Detroit, and Cleveland (see maps below).
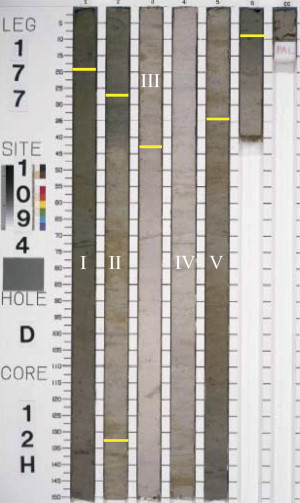
Our understanding of the climate of the Pleistocene surged in the 1950s when coring of sediment began in the deep sea and when the potential of oxygen isotopes in reconstructing ancient climate began to be realized. Cores showed dramatic alternations or cycles in the type of sediment with sharp color changes from red or pink to white or gray. The cycles were found to correspond to changes in the amount of the mineral CaCO3 that is derived from the shells of deep-sea organisms. The alternations were interpreted as major switches in the circulation of the deep ocean with corresponding changes in the ventilation and corrosiveness of the waters in which the sediments were deposited. Planktonic foraminifera, in different phases of the cycles, were found to have different oxygen isotope ratios that were interpreted as fluctuating sea surface temperature and glacial ice volume.
From studying cores of ice and deep-sea sediment, we now know that there have been more than 25 different advances and retreats over the last 2.5 million years. In fact, as the sediment and ice cores were gleaned, it was found that a number of the proxies fluctuated in a regular and periodic fashion. It had long been known from theoretical astronomy that the Earth’s orbit around the sun varies as a function of regular fluctuations in the shape of the orbit (called Eccentricity), the tilt of the axis of rotation (called Tilt or Obliquity), and the wobble of that axis (called Precession) (please see video below). Since these fluctuations control the amount of solar insolation received at the Earth’s surface, there was known to be a strong climate effect. These changes are cyclic with regular frequencies (the time from beginning to end of one cycle). From astronomical theory, the Eccentricity cycle is known to have a frequency of 100,000 and 400,000 years (two different cycles), Tilt/Obliquity a frequency of 40,000 years and Precession a frequency of 20,000 years. The Pleistocene proxy records were found to contain some of the same frequencies as these orbital fluctuations, and this is proof that changes in the amount of solar insolation were the ultimate control on the Pleistocene ice ages. The figure below shows an oxygen isotope record with prominent 41,000 and 1000,000-year cycles.

Credit: Five Myr Climate Change from Wikimedia, licensed under CC BY-NC-ND 2.0
The video below provides an overview of how the Earth's orbit varies and how it affects climate.
Video: Earth's Orbit and Climate (1:49)
The Earth's orbit around the Sun varies in a number of ways that impact the amount of solar radiation and its distribution on the Earth's surface. This variation is cyclical, meaning that over a number of years the parameter increases and decreases in a periodic fashion. The orbital parameters can be observed in a number of paleo-climate records ranging from the waxing and waning of ice sheets to paleo-temperature records. The first orbital parameter is known as eccentricity. This has a cycle of 400,000 years and 100,000 years and describes the shape of the Earth's orbit around the Sun, which varies from a shape that's more elliptical to less elliptical. The second orbital parameter is known as obliquity. It's also known as tilt, and this parameter has a periodicity of 41,000 years and it describes the tilt of the Earth's axis as it circles the Sun. The third parameter is known as precession. Precession has a periodicity of 23 thousand years and precession describes the time of year at which the earth is closest to the Sun and farthest away from the Sun. All three parameters describe the amount and distribution of solar radiation received at any point on the Earth's surface.
The figure below shows temperature (derived from O-isotopes), atmospheric CO2 measured from gas bubbles, and dust concentrations in ice samples from the famous Vostok ice core from Antarctica. The climate fluctuations shown by these data are some of the most abrupt and regular in the geologic record. The data show a close relationship between temperature and atmospheric CO2 content that is not fully understood but probably is related to intensified ocean circulation during glacial intervals that led to vigorous upwelling in the Southern Ocean. The Southern Ocean is one of the most productive areas in the oceans and intensified upwelling and photosynthesis could have led to the increased removal of CO2 from the atmosphere. Intensified atmospheric circulation during the glacial periods is thought to have transported more dust over Antarctica causing the increase in dust concentrations.
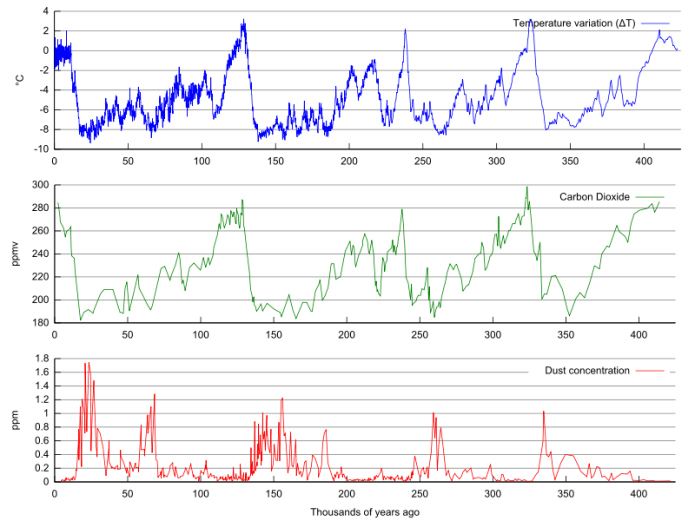
The image displays three line graphs, each representing different environmental data from the Vostok ice core in Antarctica, plotted over time. The graphs are arranged vertically on a black background with white grid lines, and each is drawn in a distinct color.
- Top Graph (Blue) - Temperature (Derived from O-Isotopes): This graph shows temperature variations over time, inferred from oxygen isotope ratios in the ice core. The blue line fluctuates significantly, with several peaks and troughs indicating abrupt climate changes. It starts at a moderate level, dips slightly, rises to a peak, experiences smaller fluctuations, and then trends upward toward the end, suggesting a general warming trend with periodic oscillations. These fluctuations are some of the most abrupt and regular in the geologic record, reflecting significant climate shifts.
- Middle Graph (Green) - Atmospheric CO2 (Measured from Gas Bubbles): This graph depicts atmospheric CO2 concentrations, measured from gas bubbles trapped in the ice. The green line shows a fluctuating pattern with a noticeable upward trend over time. It begins at a lower level, dips slightly, rises sharply to a peak, dips again, and then steadily increases with minor fluctuations, ending at a higher CO2 level than at the start. The data suggest a close relationship between temperature and CO2 content, potentially linked to intensified ocean circulation during glacial periods, particularly in the Southern Ocean, where vigorous upwelling and increased photosynthesis may have removed CO2 from the atmosphere.
- Bottom Graph (Red) - Dust Concentrations: This graph illustrates dust concentrations in the ice samples, plotted in red. The line is highly erratic, with frequent, sharp spikes and drops, resembling a noisy signal. The spikes vary in height, with some taller peaks early on, while the overall amplitude of fluctuations decreases slightly toward the end, though the line remains volatile. The increased dust concentrations are thought to result from intensified atmospheric circulation during glacial periods, which transported more dust over Antarctica.
The graphs collectively highlight the relationship between temperature, CO2 levels, and dust concentrations over time, with the Vostok ice core data revealing abrupt and regular climate fluctuations. The lack of specific axis labels makes it difficult to determine the exact time scale or numerical values, but the grid lines help visualize the relative changes in each dataset. The data suggest that glacial intervals, marked by lower temperatures, likely led to intensified ocean and atmospheric circulation, influencing CO2 removal and dust transport in the Southern Ocean and Antarctica.
As the study of the Pleistocene period has intensified, we now know that glacial-interglacial cycles also corresponded to:
- more pronounced temperature changes in the high latitudes than the low latitudes (regions near the tropics). Temperature changes in high latitude regions are thought to be about 10oC between glacials and interglacials. The variation in oxygen isotope ratios of tropical planktonic foraminifera are thought to be largely a result of ice volume changes, not temperature changes;
- abrupt swings in atmospheric circulation with wind belts such as the Intertropical Convergence Zone (ITCZ) shifting latitudinally by several degrees;
- rises and falls of sea level by up to 120 meters and advances and retreat of the shoreline across the continental shelves;
- massive floods of freshwater down rivers such as the St. Lawrence and Mississippi rivers at times when the ice melted;
- northward and southward movements of vegetation belts across the continent.
You will notice one key thing from the temperature plot above. The temperatures were higher than today about 125,000 years ago -- this interval is known as isotope Stage 5e or more informally the last interglacial. Since this time was well before humans were producing large volumes of CO2 the warming was a result of natural processes related to Earth’s orbital configuration and insolation. So this is a key interval and one very interesting facet of it is that sea levels were higher than they are today likely by between 2 and 5 meters. Since temperatures were about 2 degrees C higher during the last interglacial, this gives us some important constraints on how fast sea level may rise in coming decades depending on CO2 emissions.
The last glacial peak occurred 18,000 years ago, and since that time the planet has been steadily warming (with a number of reversals as we will see shortly). Since these fluctuations in the Earth’s orbit continue, at some stage in the future, Earth will begin to cool. At the last glacial, maximum temperatures were considerably cooler in the high latitudes. Also, the sea level was over 120 meters lower.
Video: Feedback (:57)
Feedback is when a natural process amplifies or dampens climate change. The feedback may be positive when the natural process amplifies climate change, or negative when the natural process dampens climate change. An example of positive feedback is methane dissociation in permafrost. Warming leads to the breakdown of permafrost, leading to the outgassing of methane into the atmosphere, which leads to more warming, which will, in turn, lead to more methane dissociation in permafrost. An example of negative feedback is the weathering cycle. Global warming amplifies weathering and weathering draws down C02, which will dampen further global warming.
These fluctuations have significant potential in informing us about future climate changes. For example, the shape of the glacial climate cycles illustrates that the warming arm is rapid but the cooling arm is much slower. This distinction tells us about the mechanics of positive and negative feedbacks in Earth's climate.
