Climate Records
Google the words “hockey stick,” and in addition to advertisements for sporting equipment, you will find links to one of the most chronicled and scrutinized datasets in modern science, the climate record of the last millennium. The curve was originally documented in a paper authored by Penn State Meteorology and Geoscience Professor Michael Mann and his colleagues. As shown in the figure below, the curve shows fairly constant temperatures or even a modest cooling from 1000 to about 1900 AD. About 1900, a sharp warming trend began, the base of the hockey stick. This warming has continued almost unabated to the present day. It so happens that the base of the stick corresponds to later stages of the industrial revolution, a time when the release of greenhouse gases from fossil fuels to the atmosphere spiked. The correlation of warming and the increase in levels of greenhouse gases, which are known to trap heat in the Earth’s atmosphere, is hard to argue with.
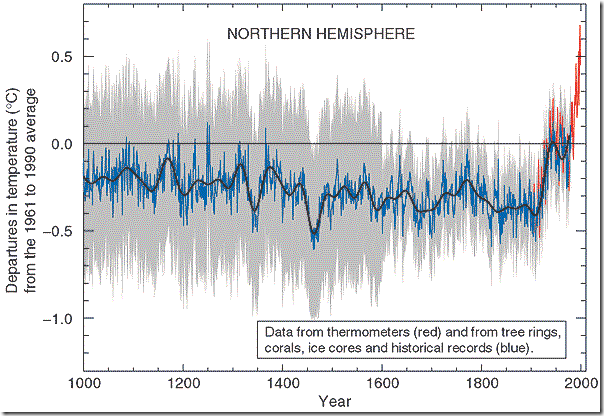
Perhaps the most scrutinized aspect of the hockey stick graph, and where the scientific controversy has focused, is that a part of the data set derives from temperature measurements that have been made since about 1900. The remainder of the curve derives from historical records and "proxy" measurements that are made indirectly. "Proxies" are substitute measurements that are made to determine the conditions at times before humans could measure climate directly. Such proxies serve as the basis for our understanding of past climate. In this module, we will learn how proxy measurements are made.
Fortunately, the history of the earth, including the evolution of its physical environment and its life forms, is beautifully preserved by a variety of Earth processes. For example, as we discussed briefly on the last page, sediments deposited in the ocean basins accumulate in a layer-cake fashion and entrap the fossil remains of once-living organisms. In addition, when these organisms, including species of clams and corals, were living, they recorded Earth’s climate history in the chemistry of layer upon layer of their shell. Images of a layered clamshell and coral skeleton are shown below.
Samples of Climate Records
Video: Sedimentation (1:02)
There are three different sources of sediment to the deep sea sedimentary record. The first is terrigenous material that is delivered via rivers into the oceans. The second is dust that is blown in from the continents by winds. And the third is biogenic material, formed by organisms that lived on the surface of the ocean that died and then subsequently rained down through the water column to the seafloor. Regardless of source, these types of material are buried in the deep sea sedimentary record. The nature of the sedimentation process is such that the youngest material lies close to the sea floor, and as the sediment becomes progressively deeper, it becomes progressively older. Thus, the deep sea sedimentary record provides a beautiful inventory of ancient climate from younger to older.
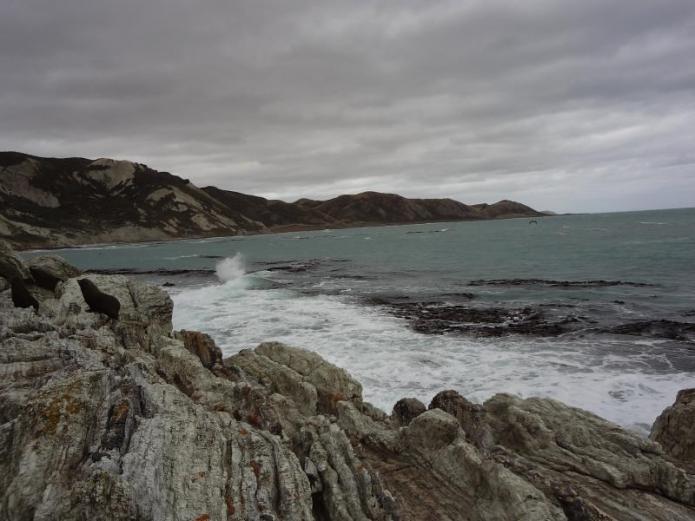
As we will detail below, chemical proxies allow the climate to be reconstructed from shell materials many hundreds of millions of years old. In fact, some of the best records of Earth’s climate are obtained from mile upon mile...., sorry kilometer upon kilometer, of cores removed from the ocean floor. The current ocean basins are less than 180 million years old, meaning that only the last 180 million years of Earth’s history are preserved in the current ocean. Fortunately, large-scale Earth tectonic processes have elevated vast piles of sedimentary rocks onto the land, where they are preserved in mountains and elsewhere. These materials can be sampled in road cuts and cores and climate information gleaned from them, taking our understanding of climate history much further back.
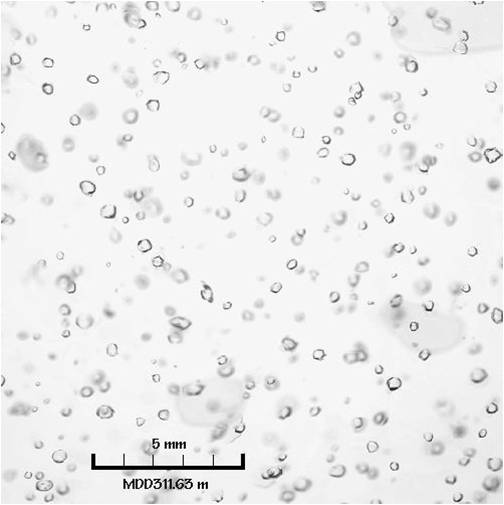
The major ice sheets have accumulated layer by layer over time. These layers record temperature, precipitation, and wind patterns at the time the ice formed. Tiny gas bubbles trapped within the ice preserve the composition of the atmosphere including levels of CO2 and methane (CH4). Kilometer upon kilometer of cored ice and the bubbles within it preserve an incredible record of Earth's climate variations for hundreds of thousands of years. See the images shown below of the GISP2 Ice Core and a sample of atmospheric gas bubbles in ice.
Video: Ice Accumulation (1:34)
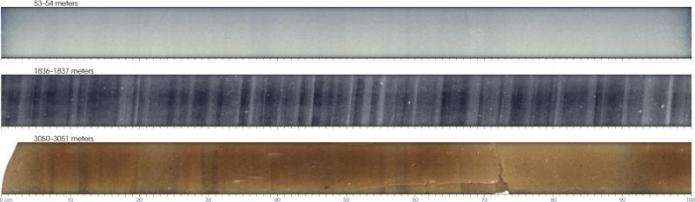
Ice cores provide valuable inventories of ancient climate. This slide here shows various levels of the ice core, illustrating how the physical properties of ice change from the surface down to the bottom. Ice formed from snow that was precipitated on the top of the glacier. The uppermost panel shows the properties of snow, very loosely compacted, showing the few annual layers that we'll describe later on, in the snow, and very small trapped bubbles of air. In the middle panel, from deeper within the glacier, approximately 1838 meters down, the ice is more compacted and shows a very strong annual banding with darker layers indicating slow accumulation rates of ice during the warmer months, and lighter layers showing the rapid accumulation of ice during the winter months. In this layer, you can see, nicely trapped bubbles of gas. Close to the bottom of the glacier, where erosion of the underlying bedrock is common, the glacier has a dirty color, a brown color, because of the content of eroded minerals and rock particles in the ice. This here shows the glacier close to the base, at about 3000 meters below the surface.
The accumulating ice also preserves dust, smoke, pollen, and ash from volcanic eruptions. The texture of summer snow and winter snow is very different, and the resulting layers provide very accurate means to determine the age of ice cores, as does C-14 dating of the CO2 trapped in ice bubbles. In this way, the composition of the atmosphere can be determined hundreds of thousands of years back in the past. Imagine this, the air that your great-great-great-great grandparents breathed has been collected in some lab around the world!