
El Niño-Southern Oscillation (ENSO)
Overview
El Niño, the most powerful control on weather across the planet, is rearing its ugly head as we speak. The telltale signs are building, and atmospheric scientists are predicting one of the most powerful El Niño events in history, certainly the strongest since 1998. This actually could be very good news for drought-stricken California, as El Niño typically delivers a lot of rain and snow to the state. In the case of California, the drought has been so severe that rains last winter caused massive mudslides. And the rain caused so much new vegetation to grow, and this served as fuel for the fires in Summer 2017. Southern Australia becomes very dry in El Niño years, and the drought causes great hardship for farmers and can often lead to very dangerous bushfires. And in Peru, El Niño comes with changing ocean currents that lead to the collapse of fisheries and great financial hardships. In this section, we learn about ocean circulation and how it impacts climate on a global scale.
One of the clearest examples of the influence of the oceans on climate is the El Niño Southern Oscillation (ENSO). This is the strongest inter-annual (i.e. periodic) variation in the modern climate system. The ENSO cycle lasts between two to seven years (average of 4 years) and corresponds to sea surface and thermocline temperatures and atmospheric pressure changes in the Pacific Ocean that ultimately have effects on weather and surface ocean conditions across the globe. The ENSO cycle consists of two main climatic intervals, the El Niño interval and the La Niña interval. The El Niño stage begins with an increase in sea surface temperatures across the eastern Pacific as warm waters spread from the west.
Typically, there is a very large east to west SST gradient across the Pacific, but El Niño virtually erases this gradient. For reasons that are not fully understood, the El Niño stage is characterized by high atmospheric pressure in the western Pacific. The opposing La Niña stage is characterized by relatively cool waters in the eastern tropical Pacific and low atmospheric pressure in the western Pacific. The westward trade wind flow piles up warm water in the western Pacific and this causes sea level to be higher by about 20 cm in the western compared to the eastern Pacific (so sea level is, relatively speaking, higher in the eastern Pacific during El Niño). To compensate for this wind flow, the thermocline slopes down upwards towards the eastern Pacific, resulting in greater stratification in the east. The slope of the thermocline shallowing changes markedly during ENSO. As El Niño piles up warm water in the eastern Pacific, the thermocline deepens in that location, whereas the La Niña part of the cycle corresponds to a very shallow thermocline in the eastern Pacific.
The following animation shows how an El Niño event in 1997 developed in the tropical Pacific Ocean:
Video: Visualizing El Niño From NASA Scientific Visualization Studio (2:28)
[Music]
NARRATOR: El Niño, the world's biggest climate phenomenon, returned stronger than ever in 1997. Satellite, ship, and buoy observations show the onset of this warming of the Eastern Pacific Ocean as early as May. El Niño globally changes precipitation and temperature patterns, often with destructive results. Visualizing how three key data sets differ from normal conditions reveals the magnitude of the 1997-1998 event and gives new insights into how the ocean and atmosphere couple to produce El Niño.
First, we look at sea surface height. The gray sheet rises and dips as much as 30 centimeters from normal. Next, we map sea surface temperature. Red is 5 degrees celsius above normal and blue, 5 below normal. Finally, black arrows are added to mark sea surface winds. A weakening of the trade winds in the far western Pacific fuels an eastward moving wave. Sea level is raised as the wind-swept wave progresses.
The wave's arrival at the South American Coast reduces the normal upwelling of cold water and warms the surface by as much as 5 degrees celsius. Intense atmospheric convection associated with Equatorial Ocean warming causes local winds to converge, abating the trade wind's strength and extending the warm pool of water into the Eastern Pacific.
Beneath the ocean surface, warm and cold waters are separated by the thermocline, a boundary at 20 degrees celsius. El Niño flattens the thermocline, squeezing the warm bulge of water eastward into a long, shallow pool. As scientists collect more detailed data through efforts such as NASA's Earth Observing System, visualization will be crucial in probing the elaborate interactions and far-flung effects of future El Niños.
Visualizing how three key datasets differ from normal conditions reveals the magnitude of the 1997-98 event and gives new insights into how the ocean and atmosphere couple to produce El Niño. First, we look at sea surface height. The gray sheet rises and dips as much as 30 centimeters from normal. Next, we map sea surface temperature. Red is 5 degrees Celsius above normal and blue 5 degrees below normal. Finally, black arrows are added to mark sea surface winds.
A weakening of the trade winds in the far western Pacific fuels an eastward moving wave. Sea level is raised as the windswept wave progresses. The waves arrival at the South American coast reduces the normal upwelling of cold water and warms the surface by as much as five degrees Celsius. Intense atmospheric convection associated with equatorial ocean warming causes local winds to converge, abating the trade winds strength and extending the warm pool of water into the eastern Pacific. Beneath the ocean surface, warm and cold waters are separated by the thermocline, a boundary at 20 degrees Celsius. El Niño flattens the thermocline, squeezing the warm bulge of water eastward into a long, shallow pool. As scientists collect more detailed data through efforts such as NASA's Earth observing system, visualization will be crucial in probing the elaborate interactions and far-flung effects of future El Niños.
As you may recall from Module 2, there is a good correlation between El Niño events and warmer temperatures on a global scale; in fact, a good part of the temperature variation superimposed on the general warming trend of the last 60 years can be explained by ENSO variability. This can be seen in the figure below (from Module 2).
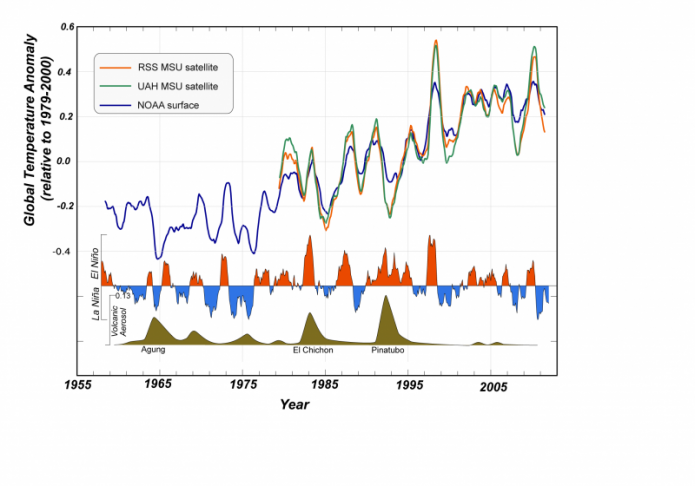
During an El Niño event (red parts of the ENSO curve), more water vapor is added to the atmosphere, making it warmer, and during a La Niña event (blue parts of the ENSO curve), less water vapor makes it into the atmosphere, so the global temperature drops. Remember that water vapor is a greenhouse gas, and it also transports heat to the atmosphere when the vapor condenses to form water droplets (clouds and rain).
ENSO has major implications on weather across the globe. For example, drought conditions in 2012 in the Midwest are a direct result of the ENSO cycle. El Niño intervals correspond to increased precipitation in California and eastern South America, due largely to the ability of warm water to hold more moisture than cold water. The warm surface water in the eastern Pacific also increases surface ocean stratification and decreases upwelling offshore Peru and Ecuador. The implications of diminished upwelling are severe for coastal fisheries in these countries. Warm water also increases the occurrence of bleaching in the Caribbean and eastern Pacific corals. The position of the high-pressure region in the Pacific affects the tracks of Pacific cyclones. In the Atlantic, increased wind shear during El Niño intervals inhibits the formation of hurricanes. El Niño intervals also correspond to cooler and wetter winters in Florida and the southeastern US, and warmer and drier winters across the northern tier of the US and in Canada. The La Niña phase corresponds to the opposite conditions from El Niño, most notably an increase in the frequency in Atlantic hurricanes as conditions become more favorable for their formation (i.e., less shear in the tropical Atlantic).