
Ocean Futures
Overview
Since records have been kept, the average temperature of the global surface ocean has warmed by more than 1oC. Models suggest that all areas of the surface ocean will warm significantly more than this by 2100, especially in the high latitudes. This warming will have major implications for a number of key processes in the oceans, some of which will impact climate and weather patterns on land. In this section, we discuss the impact of climate change on the intensity and frequency of hurricanes, the potential shutdown of the global conveyor belt, the intensity of the ENSO cycle and the occurrence of oceanic hypoxia.
Hurricanes
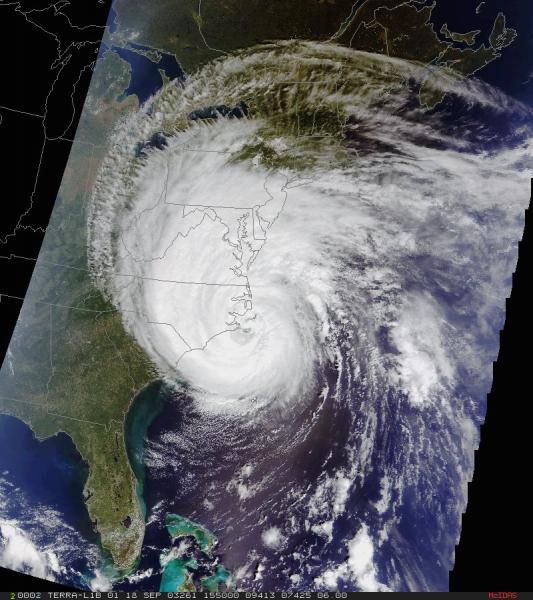
Many of you learned about the devastating force of hurricanes when Katrina hit New Orleans in August 2005. In fact, there have been a number of devastating hurricanes over the last few decades with Hurricane Hugo (Charleston) in 1989, Hurricane Andrew (South Florida) in 1992, and Typhoon Yasi in the Pacific (Australia) in 2011. Atlantic Hurricanes and Cyclones in the Pacific Ocean get their energy from the warm tropical ocean, so wouldn’t it follow that a warmer ocean will fuel more deadly hurricanes? Well, it’s not quite that simple and is more than a little controversial.
Early in spring, Bill Gray from Colorado State University puts out an annual hurricane forecast for the late summer and fall Atlantic Hurricane season. Gray’s forecast is based on a number of factors including sea surface temperatures in the tropical Atlantic, a number of atmospheric parameters, and the stage of the ENSO cycle. While hurricane experts agree about the feasibility of season forecasting, there is much less consensus among them about the effect of climate change on storms. Part of the problem is that coupled climate-ocean models do not have the resolution to forecast storms with a great deal of accuracy.
Since 1980 there has been a marked increase in the SSTs in the tropical Atlantic from August to October, the interval when hurricanes are formed, and the maximum power dissipation of hurricanes, which is the product of the summed maximum wind speed cubed and its duration. In fact, the agreement between these parameters is exceptional. Yet over the same time period, there is no observed increase in the frequency of hurricanes. In fact, when climate modelers downscale models of future climate to attempt to observe predictions for smaller regions than models typically yield, the result is a prediction of increased hurricane intensity but actually fewer storms in the future.
Global Conveyor
As we have seen earlier, the North Atlantic Ocean is the central driver of the global conveyor. Changes in density of surface waters in the Norwegian Sea as a result of warming, increased precipitation and melting of Greenland Ice can impact the flow of water downwelling as NADW. Sufficient changes in density could potentially shut down the production of NADW and literally halt the global conveyor. This, in turn, would have major implications for global climate.
You might find it hard to believe that such a massive engine of water and heat transport could possibly shut down. However, it has happened numerous times in the past, and this is perhaps the strongest evidence that it could happen in the future. Moreover, the past shutdowns have occurred over very short time intervals. Here, we will summarize our current understanding of the likelihood of GCB shutdown.
Approximately 8200 years ago, in the midst of the gradually warming climate of the current interglacial, a very abrupt cool period occurred that was likely the result of rapid melting of the Northern Hemisphere ice sheet and the flow of massive amounts of freshwater into the North Atlantic Ocean. The event was about 10-15 years long---a geologic heartbeat---and was likely due to a massive breach of the meltwater over a barrier in the St Lawrence Seaway. The impact of the flood of freshwater across the surface of the North Atlantic Ocean was to decrease the density of the water to such an extent that downwelling virtually stalled. The switching off of thermohaline circulation drastically slowed oceanic heat transport, which in turn led to rapid cooling in the Northern Hemisphere, especially in Northern Europe.
Moving on to the present day, flow of NADW is likely weakening due to increasing SSTs and freshening of the North Atlantic. Freshening is the result of melting of Greenland ice, as well as increased moisture transport in a warmer atmosphere. However, detection of a slowdown is very difficult as the meridional overturning circulation is highly variable, with a yearly average of 18.7 Sverdrup (a Sverdrup is one million m3 per second), but a range of 4.4 to 35.3 Sverdrup. Weakening is likely to continue into the future, also as a result of increased precipitation in northern high latitudes. However, most coupled ocean-models suggest that under realistic emission scenarios, thermohaline circulation will continue to slow but not shut down. The consensus of model runs suggests reductions of 10-50% in meridional overturning circulation intensity in the year 2100. However, these predictions are somewhat difficult because the relationships between many of the variables are not linear, rather there appear to be thresholds or tipping points that make prediction difficult.
What does this weakening of the NADW mean for the climate? Most ocean models show that as it weakens, less of the Gulf Stream warmth travels to high latitudes. Today, this warmth accounts for something like 30% of all the heat supplied to the Arctic region, so as the NADW weakens, models predict less heat moving into the Arctic. This might lessen the expected dramatic warming in the Arctic, but if it slows too much, there is a chance that the Arctic could become much colder — and very rapidly — as it did during the Younger Dryas event about 11 thousand years ago.
ENSO
The connection between climate change and changes in the duration and intensity of ENSO events has been hotly debated as the relationship of extreme weather events (often connected to ENSO) and climate change has been debated. Are extreme events getting more extreme as a result of climate change or is this just a part of the normal ENSO variability? Examples include major blizzards in the northeastern US during La Niña years and intense “Pineapple Express” rainfall in California during the El Niño stage of the ENSO cycle. As easy as it is to attribute such extreme events to climate change, reality is not nearly that simple, as these events fall under weather and not climate and much longer-term changes are required before an empirical connection can be made with certainty.
Models do not agree on the effects of warming on the ENSO cycle and so we will have to wait to see what happens in the future.
Ocean Dead Zones or Hypoxia
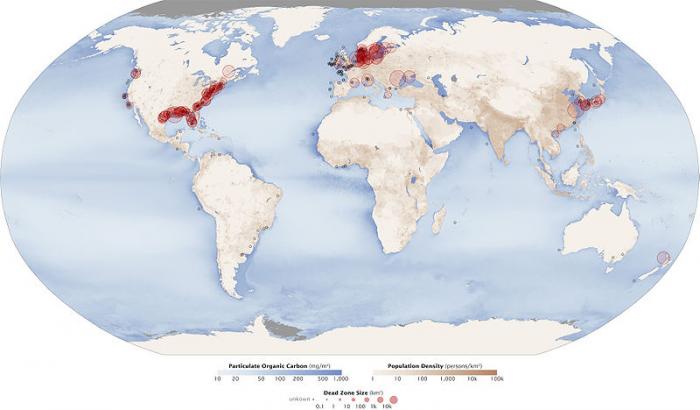
Another great threat to marine environments is hypoxia, a condition in which seawater or freshwater becomes deficient in oxygen. As with harmful algal blooms, the main culprit for hypoxia is nitrification from agriculture or pollution. This oxygen deficiency can cause massive fish kills that can devastate coastal economies. Since warm waters can hold less oxygen than cold waters, climate change will render coastal regions more prone to hypoxia in the future. Hypoxia tends to occur when waters become increasingly stratified, which is gradually occurring in many coastal areas.
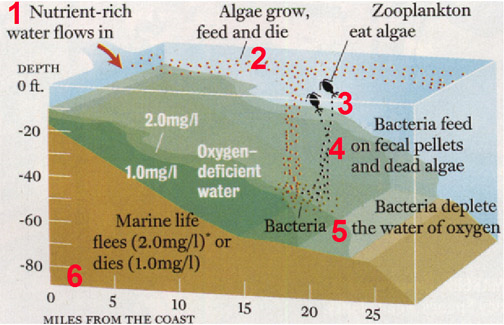
A diagram illustrating the ecological impact of nutrient-rich water on marine life near a coast, focusing on oxygen depletion and its effects. It presents a cross-sectional view with the coast on the left, extending 25 miles into the ocean on the x-axis, and depth from 0 to 80 feet on the y-axis. The diagram is divided into numbered steps: (1) nutrient-rich water near the coast, (2) algae growth feeding on nutrients, (3) zooplankton consuming algae, (4) bacteria feeding on fecal pellets and dead algae, (5) bacteria depleting oxygen in the water, and (6) marine life dying due to low oxygen levels (2.0 mg/l or 1.0 mg/l). Green and brown shading indicates oxygen-deficient zones at different depths.
- Axes
- X-axis: Distance from the coast (0 to 25 miles)
- Y-axis: Water depth (0 to 80 feet)
- Coastal Area
- Position: Left side
- Color: Brown
- Steps of Ecological Process
- Step 1: Nutrient-rich water
- Position: Near the coast
- Color: Green shading
- Step 2: Algae grow, feed
- Position: Near the surface, 0-20 feet depth
- Representation: Small green dots
- Step 3: Zooplankton eat algae
- Position: Near the surface, 0-20 feet depth
- Representation: Small black dots
- Step 4: Bacteria feed on fecal pellets and dead algae
- Position: Mid-depth, 20-60 feet
- Representation: Small brown dots
- Step 5: Bacteria deplete the water of oxygen
- Position: Mid-depth to bottom, 20-80 feet
- Color: Brown shading
- Oxygen Levels: 2.0 mg/l and 1.0 mg/l zones marked
- Step 6: Marine life dies (2.0 mg/l or 1.0 mg/l)
- Position: Bottom layer, 60-80 feet
- Representation: Text indicating impact
- Step 1: Nutrient-rich water
- Oxygen-Deficient Zones
- 2.0 mg/l Zone
- Color: Light brown
- Position: 20-60 feet depth
- 1.0 mg/l Zone
- Color: Dark brown
- Position: 60-80 feet depth
- 2.0 mg/l Zone
- Water Body
- Color: Blue, with green and brown shading for nutrient and oxygen levels
- Position: Central and right side of the diagram
The northern Gulf of Mexico is a region where a seasonal dead zone is now well established. This dead zone was first noted in the 1970s and has gradually grown in size and intensity since. The critical driver for hypoxia is the outflow of nutrients from the Mississippi River. The Mississippi drains an enormous agricultural region of the mid-continent and thus acquires a very high level of nutrients. These spur production by algae in the surface ocean, which in turn rains down and utilizes oxygen in the deeper water column. The dead zone appears in spring as nutrient loads increase and peaks in late summer as oxygen becomes steadily depleted, exacerbated by the fact that warmer waters hold less oxygen than colder waters. Other regions with prominent dead zones include the Chesapeake Bay and Long Island Sound in the US and the Baltic Sea in Northern Europe. These areas will be more prone to hypoxia in the future.
The following video gives an overview of how hypoxia develops in the Gulf of Mexico.
Video: Gulf of Mexico Dead Zone (3:50) This video is not narrated.
TEXT ON SCREEN: The Dead Zone
Nutrient Runoff Creates Hypoxia in the Gulf of Mexico
Data provided by: Maria A. Faust (Smithsonian Institution)
Katja Fennel (Dalhouse Univ)
Robert Hetland (Texas A&M)
Did you know that half of the oxygen that we breathe comes from tiny organisms that live in the ocean? It’s true! These microscopic marine organisms, called phytoplankton, produce oxygen just like land plants. But phytoplankton are not plants, they are Protists, single celled organisms. They are so small that thousands of them can fit in a single drop of water. In order to study phytoplankton, scientists often use microscopes or satellites.
From space we see Earth like this… but some satellites see Earth like this… a dance of rainbow colors. In this case, the colors represent the concentration of phytoplankton in the oceans; red is high concentration; blue is low concentration.
Phytoplankton depend on nutrients and the proper temperature and light conditions to grow and reproduce. Coastal areas are extremely rich in nutrients, which have been washed off the land by rivers. Areas such as the open ocean have lower concentrations of phytoplankton because of the limited amount of nutrients there.
The mouth of the Mississippi River is a perfect example of how nutrient run-off creates plankton blooms. 41% of the United States drains into the Mississippi River and then out to the Gulf of Mexico. That’s a total of 3.2 million square kilometers of land, or about 600 million football fields. About 12 million people live in urban areas that border the Mississippi, and these areas constantly discharge treated sewage into rivers. However, the majority of the land in the Mississippi’s watershed is farm land. Each spring as farmers fertilize their lands preparing for crop season, rain washes fertilizer off the land and into streams and rivers. All of the urban and farm discharge includes nutrients such as nitrogen and phosphorus that are very important for the growth of phytoplankton. Incredibly, about 1.7 million tons of these nutrients are dumped into the Gulf of Mexico every year. Once the Gulf of Mexico receives this huge influx of nutrients, massive phytoplankton blooms occur. These blooms result in an area called the Dead Zone — areas with such low oxygen concentration that few organisms can survive there.
But if phytoplankton blooms produce oxygen, then why does a Dead Zone occur? For animals, such as microscopic zooplankton and fish, phytoplankton blooms are like an all-you-can-eat buffet. Small animals eat the phytoplankton, and are in turn eaten by bigger fish. All along, these animals are releasing waste, which falls to the bottom of the Gulf. There lurk bacteria that decompose the waste, and in the process use up the oxygen, creating hypoxic conditions. The different densities of fresh water from the Mississippi and salt water from the Gulf create barriers that prevent mixing between the surface and deep waters. Soon there is not enough oxygen for other organisms to use. The Dead Zone has arrived. But as summer turns to fall, winds help to stir up the water, allowing the layers to mix and replenish oxygen throughout the water. Eventually, the Gulf and its fish population return to normal… until next year.