
Major Deep Water Masses
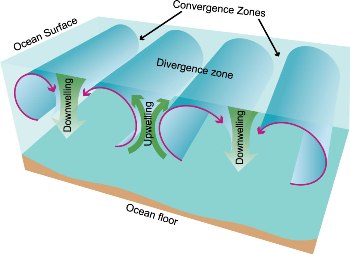
The image is a diagram illustrating ocean water movement, highlighting convergence zones, divergence zones, upwelling, and downwelling processes. It features a cross-sectional view of the ocean, with the ocean surface at the top and the ocean floor at the bottom. The diagram shows water circulation patterns with arrows indicating movement: green arrows represent upwelling (water rising from the ocean floor) and downwelling (water sinking from the surface), while blue arrows indicate broader circulation. The convergence zones are marked where water flows meet and sink, and the divergence zone is where water spreads apart and rises.
- Top Section
- Feature: Ocean Surface
- Color: Light blue
- Position: Top of the diagram
- Bottom Section
- Feature: Ocean Floor
- Color: Light brown
- Position: Bottom of the diagram
- Water Circulation Patterns
- Color: Blue arrows for general flow
- Green arrows for specific movements:
- Upwelling: Water rising from the ocean floor
- Downwelling: Water sinking from the ocean surface
- Convergence Zones
- Label: Convergence Zones
- Description: Areas where water flows meet and sink
- Position: Top center, marked with black arrows pointing inward
- Color: Indicated by overlapping blue flow lines
- Divergence Zone
- Label: Divergence Zone
- Description: Area where water spreads apart and rises
- Position: Central area, marked with green upwelling arrows
- Color: Indicated by spreading blue flow lines
The deep ocean is generally considered to include the ocean below a transition known as the thermocline. The thermocline is the sharp temperature decrease that lies at the base of the surface mixed layer, where waters are generally uniform in temperature as a result of convection. Deep-water masses are produced at the surface of the ocean and transported to depth via downwelling. Generally, downwelling occurs where the surface ocean is cool, or, rarely, unusually saline. Downwelling water travels along lines of equal density known as isopycnals and spreads out horizontally at the level where it is equal in density to the surrounding water mass.
The production of deep-water masses via downwelling occurs in high-latitude regions of the northern and southern hemispheres, where the surface ocean is cooled by winds. Wind moving over the water both cools it and causes an increase in evaporation. This evaporation targets just the water molecules, resulting in an increase in the salinity of the water. Falling temperature and increasing salinity render these surface water masses denser, allowing them to downwell. In certain locations, the formation of sea ice also causes an increase in salinity as the freezing removes fresh water, leaving the salt behind in a process known as brine exclusion. Pockets of salty water around the margins of the ice sink as a result of their higher density. Moreover, brine exclusion intensifies the cooling by wind.
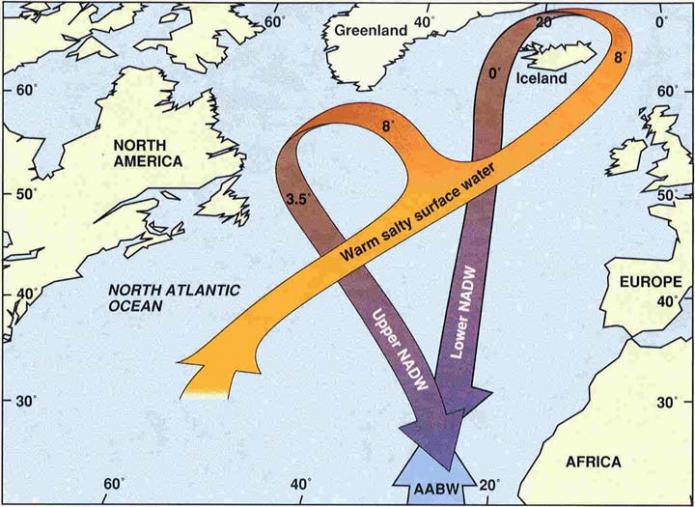
A map depicting ocean circulation patterns in the North Atlantic Ocean, focusing on the movement of water masses. It shows the North Atlantic region, including parts of North America, Europe, Africa, Greenland, and Iceland. An orange path labeled "warm salty surface water" flows from the southwestern North Atlantic near North America, moving northward past Europe and looping around Iceland and Greenland. A blue arrow labeled "upper NADW" (North Atlantic Deep Water) and "lower NADW" indicates deeper water flowing southward, intersecting the orange path. Another blue arrow labeled "AABW" (Antarctic Bottom Water) flows northward at the deepest level. Numbers along the paths (e.g., 3.5, 8) likely represent salinity or temperature values.
- Ocean Circulation Paths
- Warm Salty Surface Water
- Label: Warm salty surface water
- Path: Orange line starting near North America, moving northward past Europe, looping around Iceland and Greenland
- Values: Marked with 8 near Iceland and Greenland
- Color: Orange
- North Atlantic Deep Water (NADW)
- Labels: Upper NADW, Lower NADW
- Path: Blue arrow flowing southward, intersecting the orange surface water path
- Value: Marked with 3.5 near North America
- Color: Blue
- Antarctic Bottom Water (AABW)
- Label: AABW
- Path: Blue arrow flowing northward at the deepest level
- Position: Southern part of the map, below NADW
- Color: Blue
- Warm Salty Surface Water
- Geographic Features
- North America: Western boundary of the map
- Europe: Eastern boundary of the map
- Africa: Southeastern boundary of the map
- Greenland: Northern region, west of Iceland
- Iceland: Northern region, east of Greenland
- North Atlantic Ocean
- Position: Central area of the map
- Color: Light blue
- Latitude Markings
- Range: 20° to 60° latitude
- Position: Along the vertical edges of the map
Today there are three major deep ocean masses. North Atlantic Deep Water or NADW is mainly produced where the surface ocean is cooled in the Norwegian Sea in the northern part of the North Atlantic on the north side of a ridge that runs between Greenland, Iceland, and Scotland. This cooled water seeps through the ridge and downwells. Portions of NADW are also produced in the Labrador Sea and in the Mediterranean. This water mass is 1-2.5oC and 35 ppt. NADW travels down the west side of the North Atlantic Ocean at a depth of 2000-4000m and through the west side of the South Atlantic. Much of NADW upwells in the Southern Ocean, but portions join the Antarctic Circumpolar Current and travel at depth into the Indian and Pacific Oceans.

A cross-sectional diagram illustrating ocean water movement near Antarctica, focusing on the interaction between different water masses and the ocean floor. It depicts a layered view of the ocean, with the ocean surface at the top and the ocean floor at the bottom. The diagram shows the North Atlantic Deep Water flowing from the left, Antarctic Circumpolar Deep Water in the middle, and various water movements such as upwelling and downwelling. The Antarctic continent is on the right, with a mid-ocean ridge on the ocean floor. Labels indicate key features like the volume front and differences in water masses.
- Top Section
- Feature: Ocean Surface
- Color: Light blue with white patches indicating ice or foam
- Position: Top of the diagram
- Bottom Section
- Feature: Ocean Floor
- Color: Brown
- Position: Bottom of the diagram
- Specific Feature: Mid-ocean Ridge
- Label: Mid-ocean Ridge
- Position: Central area of the ocean floor
- Color: Dark brown
- Water Masses
- North Atlantic Deep Water
- Label: North Atlantic Deep Water
- Position: Left side, flowing from the left
- Color: Dark blue
- Antarctic Circumpolar Deep Water
- Label: Antarctic Circumpolar Deep Water
- Position: Central area, above the mid-ocean ridge
- Color: Medium blue
- North Atlantic Deep Water
- Water Movement
- Upwelling and Downwelling
- Representation: Arrows indicating water flow
- Color: White arrows
- Position: Throughout the diagram, showing vertical movements
- Volume Front
- Label: Volume Front
- Position: Left side, near the surface
- Description: Boundary between water masses
- Differences
- Label: Differences
- Position: Near the surface, above the volume front
- Description: Indicates variations in water properties
- Upwelling and Downwelling
- Antarctic Continent
- Label: Antarctica
- Position: Right side of the diagram
- Color: Brown with a white top indicating ice
- Ocean Layers
- Color: Gradient of blue, darker at the bottom, lighter at the top
- Description: Represents depth and different water masses
Antarctic Bottom Water or AABW is produced by evaporative cooling off the coast of Antarctica and under the Ross ice shelf. With this source, AABW is amongst the coldest water in the ocean with a temperature of -0.4oC. This water is relatively fresh (average 34.6 ppt). AABW travels northward along the western side of the South Atlantic underneath NADW. Some of the water mass spills over into the eastern part of the South Atlantic, while the remainder travels into the equatorial channel between South America and Africa.
The third major source of deep water is called Antarctic Intermediate Water or AIW. AIW is produced near the Antarctic Convergence or Polar Front, where downwelling occurs as a result of the convergence of surface currents. AIW has a temperature of 3-7oC and a salinity of 34.3 ppt. It travels a considerable distance northward into the Atlantic, Indian and Pacific Ocean basins.
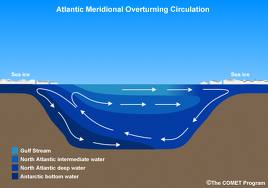
A diagram titled "Atlantic Meridional Overturning Circulation," illustrating the movement of water masses in the Atlantic Ocean. It features a cross-sectional view with sea ice at both the left and right edges, a blue ocean layer above a brown ocean floor, and arrows showing water circulation. The diagram highlights the Gulf Stream carrying warm Atlantic intermediate water northward, with deeper flows of Atlantic deep water and bottom water moving southward. The circulation pattern forms a loop, indicating the overturning process.
- Top Section
- Feature: Sea Ice
- Position: Left and right edges
- Color: White
- Bottom Section
- Feature: Ocean Floor
- Color: Brown
- Position: Bottom of the diagram
- Water Masses and Circulation
- Gulf Stream
- Label: Gulf Stream
- Description: Warm Atlantic intermediate water
- Path: Northward flow near the surface, indicated by white arrows
- Color: Light blue
- Atlantic Deep Water
- Label: Atlantic deep water
- Path: Southward flow in the middle layer, indicated by white arrows
- Color: Medium blue
- Bottom Water
- Label: Bottom water
- Path: Southward flow at the deepest layer, indicated by white arrows
- Color: Dark blue
- Gulf Stream
- Circulation Pattern
- Representation: White arrows forming a looping pattern
- Description: Shows the northward surface flow and southward deep flow
- Position: Throughout the ocean layer