
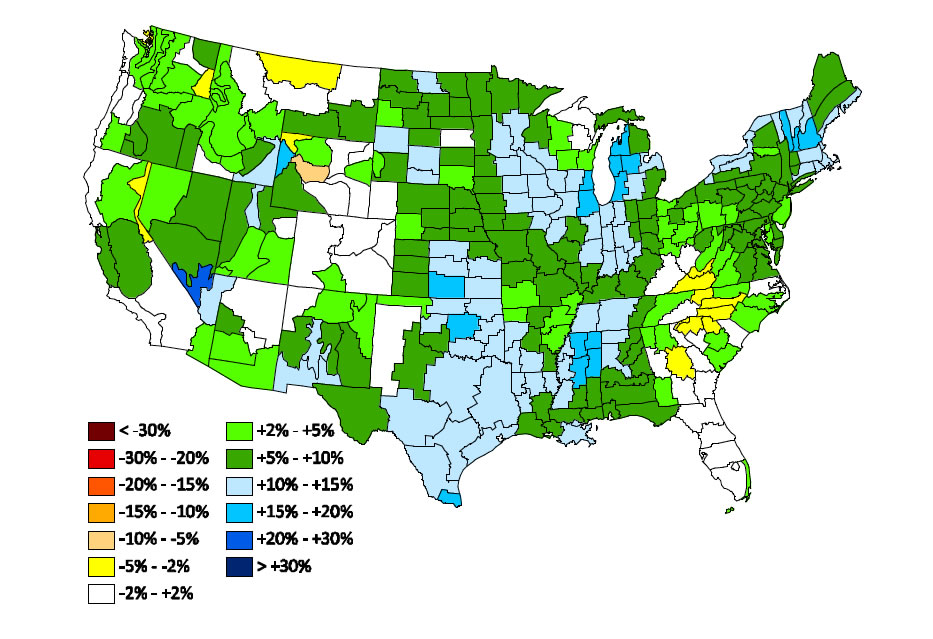
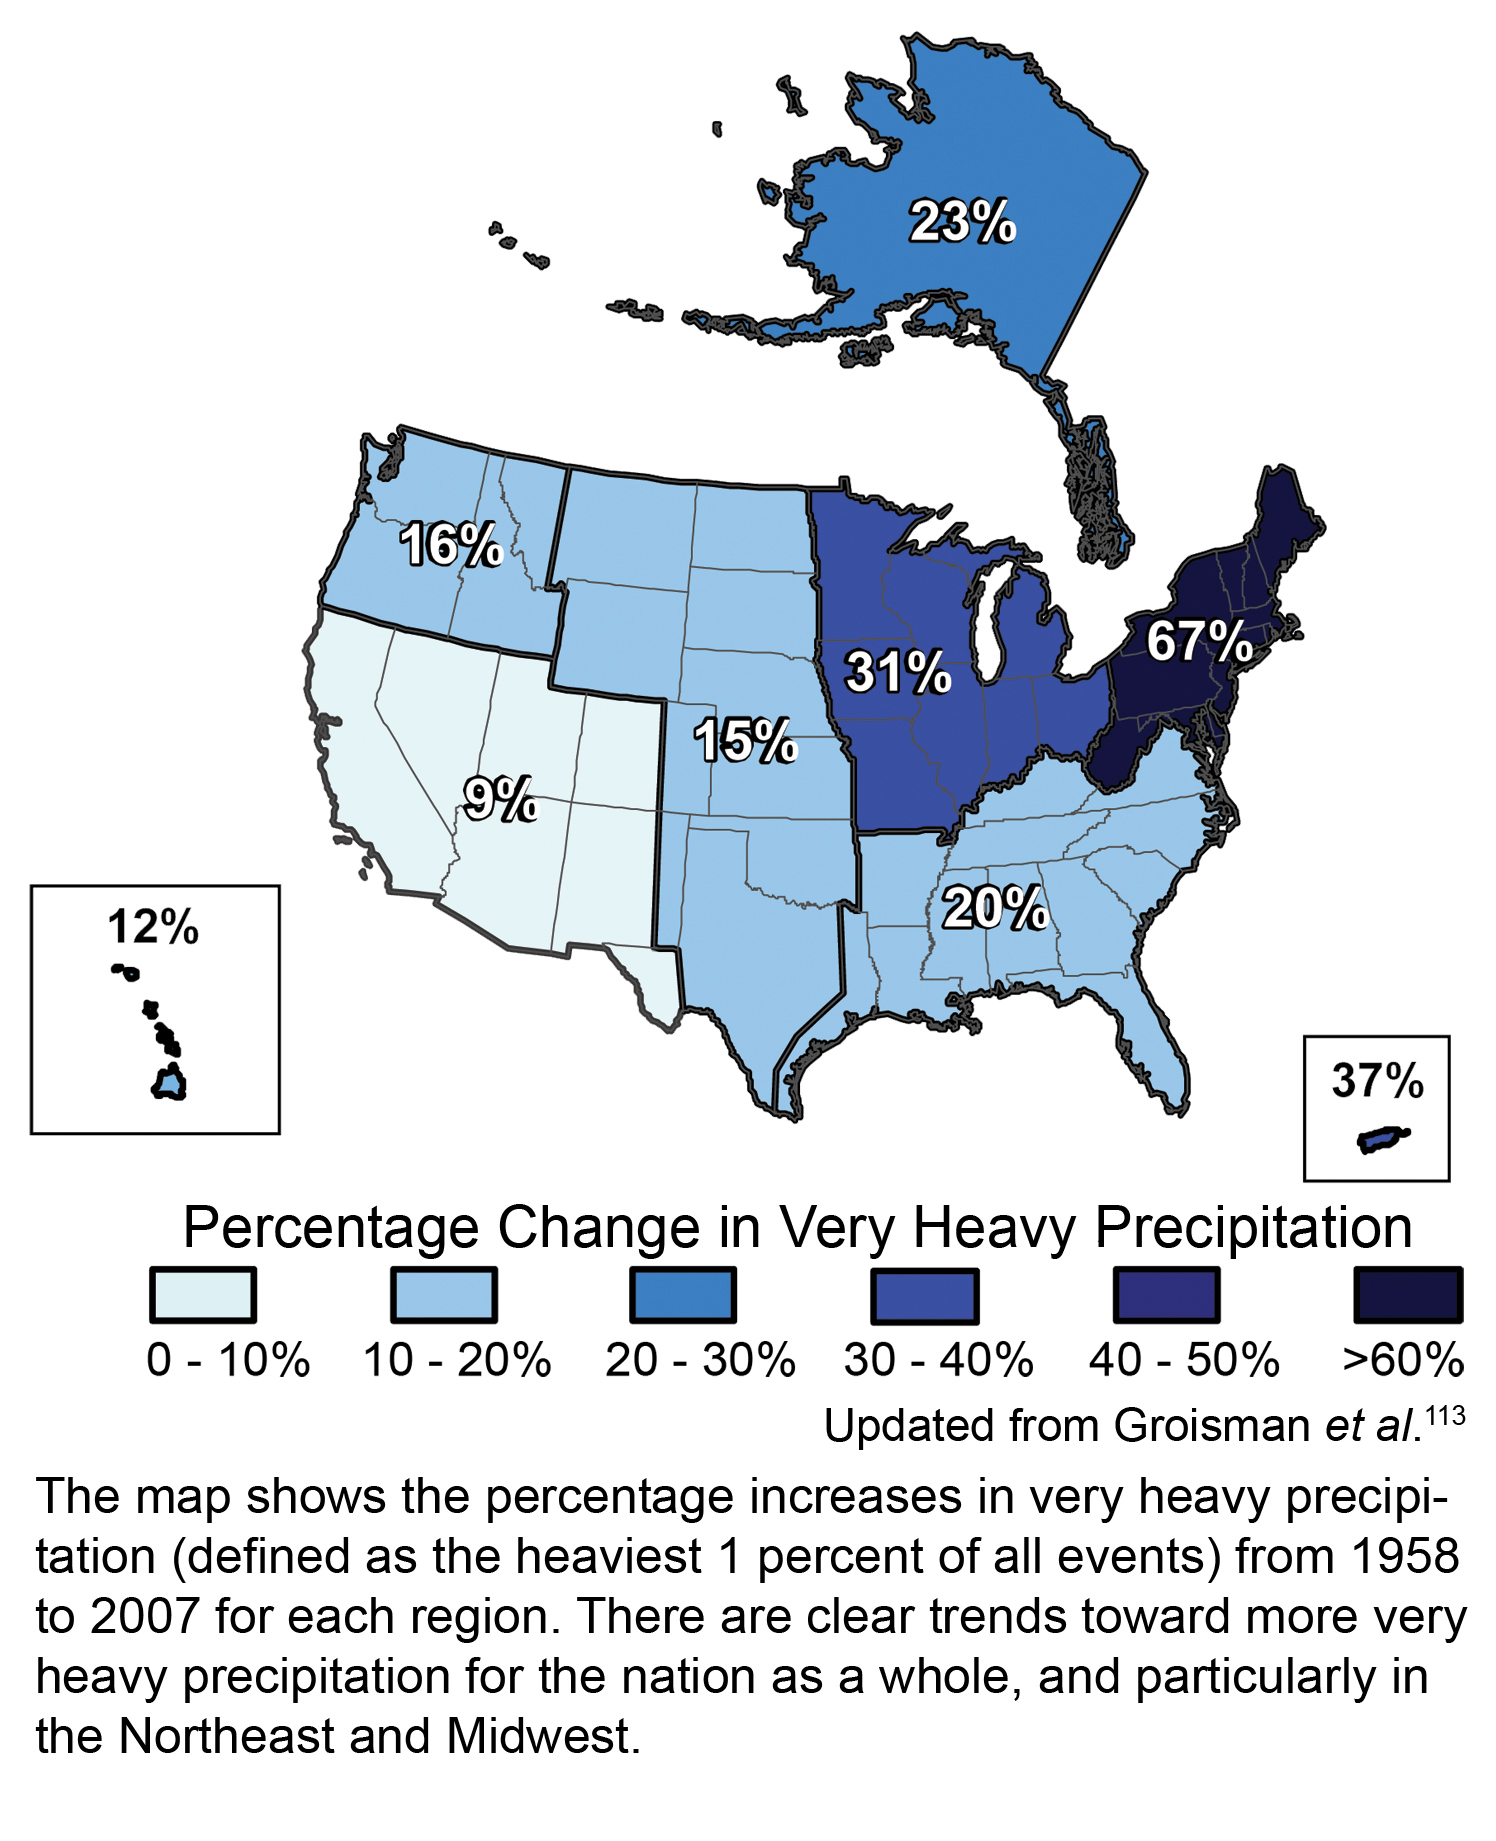
More water vapor in the atmosphere from increased evaporation causes some areas to get more rainfall. When the greater latent heat stored in the evaporation process is released by condensation–that is, the formation of clouds–this energy produces stronger updrafts with more liquid water and, ultimately, heavier precipitation. Indeed, like most other areas on Earth, observed precipitation over the United States shows that precipitation totals have been going up for the last century. Moreover, precipitation events are getting more intense and these stronger events are becoming more numerous over most of the country.
The payoff from these changes in hydrology is easy to understand and to document. Despite overall increases in precipitation, drought is becoming more frequent because in those areas where precipitation has not been increasing strongly, greater evaporation results in drier soils and less available water. Even in areas that are becoming wetter on average, a period of decreased rainfall––say, a few weeks––coupled with higher temperatures results in quick drying and rapid conversion to drought. Ironically, the more frequent, more intense downpours lead to more flash floods. Prolonged, stronger wet periods also generate more floods. Thus, climate change results in greater hydrologic variability over time and space, producing more droughts and floods overall and in any one place. Streamflow and groundwater is, therefore, more variable than ever and much harder to predict and manage.
It is worth noting that sea-level rise resulting from climate change also affects hydrology. Saltwater intrusion into coastal aquifers is increasing partly from greater extraction by growing human populations, and partly from the greater osmotic pressures produced by rising sea levels. Simply, when people install wells, they draw down the water table, causing pressure that can pull saltwater into the aquifer. Concurrently, as sea levels rise, the pressure of all that water can force saltwater into the groundwater system. Saltwater is also increasingly working its way upstream in estuaries and coastal rivers, degrading and replacing freshwater.
The impacts presented above are an important subset of the total changes to hydrology produced by climate change. The following section explores how these hydrologic impacts translate into challenges for water resource and other managers.