
It is important to recognize that climate change is neither the primary driver of human health today nor will it be in the future. Beyond genetics, access to these three factors are fundamental to the good health of an individual and a society.
- Safe water and good sanitation - More people die each year from this factor than from war and all other forms of violence. Most of these deaths occur in children less than five years of age. More than two and a half billion people do not have access to good sanitation; nearly all of those are located in the developing world. Learn more about these concerns by visiting the CDC's Global WASH Fast Facts. Does it surprise you to learn that 1 in 3 people in the world don't have access to the sanitation that many of us take for granted?
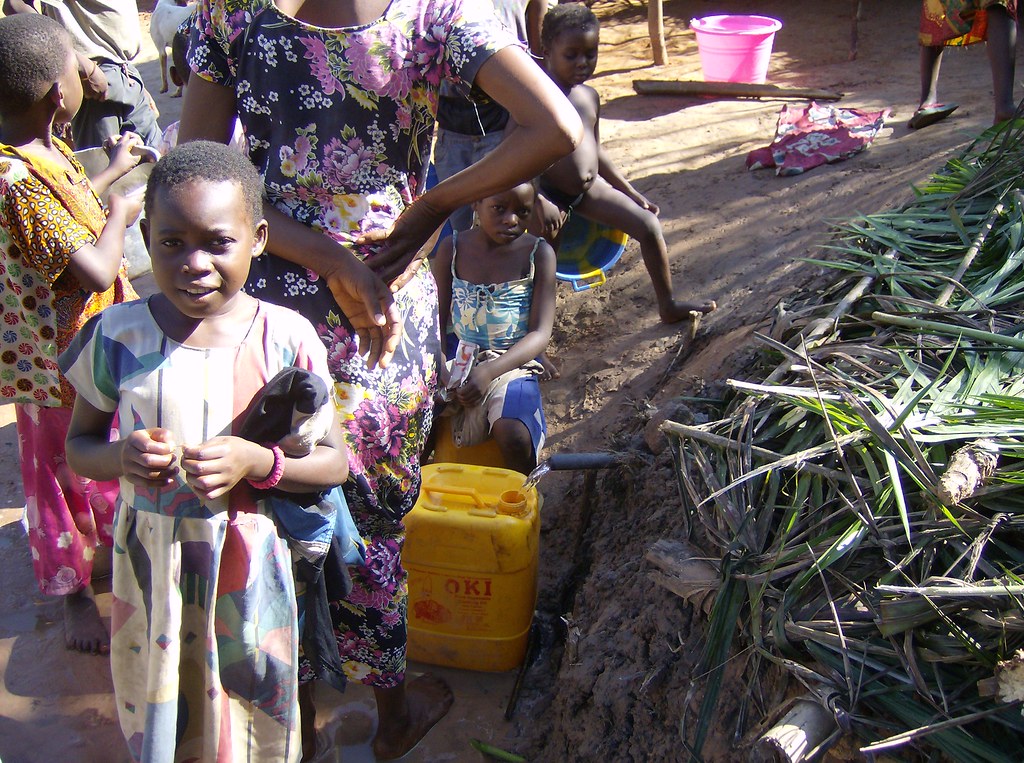 Children collecting drinking water
 - Nutritious food and food security - Undernourished people receive less than the minimum amount of food needed for sound health and growth. The World Health Organization puts the number of undernourished people at about one in nine people and nearly all of those live in the developing world. And while some of the statistics surrounding access to health food are quite sobering, there are glimmers of good news in there, too. Let's take a look at the prevalence of undernourishment as a percent of the population by global region in 2000 and 2016 (the images below are static and a bit squished, but you can watch this animation over the 16 year period if you're interested). What do you notice? With the exception of North America, all other global regions reduced their share of the population experiencing undernourishment - some rather substantially!
Indeed, food security linked to extreme climatic events is and will continue to be one of the biggest impacts of the changing climate. Many areas of the globe –– particularly in Africa –– lack basic food security. Apart from starvation, malnutrition weakens the populations of these areas and leaves them open to a host of illnesses; malnutrition-induced morbidity and mortality is greatest among the very young and the very old. Droughts and floods aggravate an already bad situation, reducing yields and sometimes causing crop failure, further weakening an already vulnerable population.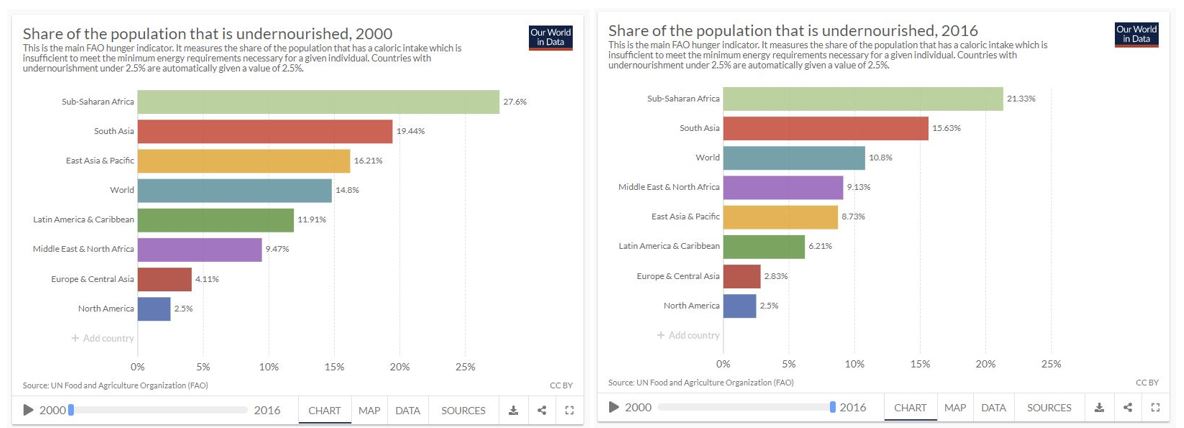 Comparison of the share of the population that is undernourished 2000 vs 2016Click here for a text alternative to the figure above
Share of the Population that is Undernourished Country 2000 2016 Sub-Saharan Africa 27.6% 21.33% South Asia 19.44% 15.63% East Asia & The Pacific 16.21% 8.73 World 14.8% 10.8% Latin America & Caribbean 11.91% 6.21% Middle East & North Africa 9.47% 9.13% Europe & Central Asia 4.11% 2.83% North America 2.5% 2.5% Credit: Our World in Data - Hunger and Undernourishment by Roser and Ritchie, 2019 is licensed under CC BY 4.0 - Health care - People in developed countries spend huge sums on health care while less-developed countries spend little. Per capita health care spending by the top 5 percent of the world population is about 4,500 times the spending of the lowest 20 percent. As the graph below indicates, there is a positive relationship between health care spending and life expectancy, with low health care spending associated with low life expectancy and high spending associated with high life expectancy. There are anomalies. For instance, Cuba, which has essentially the same life expectancy as the US, has excellent health care but spends only about an eleventh of what the US spends per person on health care. Despite the fact that it spends about twice as much per capita on health care as other developed countries, the US is only ranked 45th in life expectancy (this ranking varies a bit by source, with some estimates as high as the mid twenties but it still represents a point for discussion - the US is paying a lot for its health care but not realizing commensurate outcomes for that cost). Another measure of health care access is doctors per 100,000 people. Here the disparity between developed and less-developed countries is stark. Again, there are anomalies, such as the former communist countries, which have relative high densities of physicians. Moreover, there can be large inequalities even within the most-developed countries where rural areas often have difficulty attracting doctors.
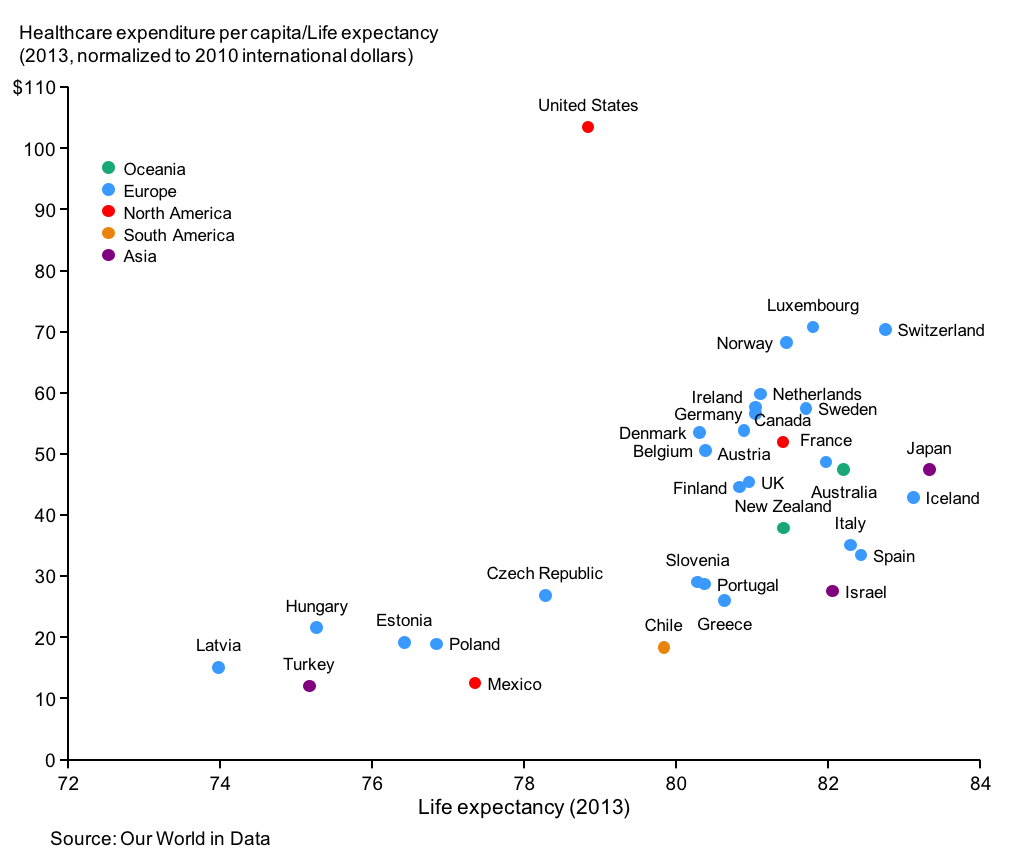
Life expectancy versus per capita health care spending.
Credit: Our World in Data -Link between health spending and life expectancy: US is an outlier by Roser, 2017 is licensed under CC BY 4.0
In summary, individuals who live in developed countries generally have better access to safe water and sanitation, good nutrition, and health care. People who live in the least-developed nations often have unsafe water and poor sanitation, inadequate nutrition, and little access to health care. Therefore, with or without climate change, health outcomes vary based on a person's country of residence and its level of development.

WHO Global Health Observatory dashboard for addressing UN Sustainable Development Goals and Health Outcomes.
Click here for a text description of this image.
SDG health and health related targets
- 3.1 Maternal mortality
- 3.2 Newborn and child mortality
- 3.3 Communicable diseases
- 3.4 Noncommunicable diseases and mental health
- 3.5 Substance abuse
- 3.6 Road traffic injuries
- 3.7 Sexual and reproductive health
- 3.8 Universal health coverage
- 3.9 Mortality from environmental coverage
- 3.a Tobacco control
- 3.b Development assistance vaccine coverage
- 3.c Health workforce
- 3.d National and global health risks
- 1.a Mobilization of resources
- 2.2 Child malnutrition
- 6.1 Drinking water
- 6.2 Sanitation and hygiene
- 7.1 Clean household energy
- 11.6 Clean cities
- 13.1 Natural disasters
- 16.1 Violence
- 17.19 Statistical capacity-building
Credit: World Health Organization: Global Health Observatory (GHO) 2019 is licensed under CC BY-NC-SA 3.0 IGO