Prioritize...
Upon completion of this section, you should be able to define general circulation models, discuss how their use in predictions is different than computer models created for weather forecasting, and discuss future temperature projections.
Read...
"It's tough to make predictions, especially about the future." This Danish "proverb" (which often gets attributed to the baseball great, Yogi Berra), is especially apt for this section. You see, to this point, we've focused on how the climate has already changed. The trends in temperature and their consequences for ice coverage, atmospheric moisture, extreme weather, etc., that I've discussed are things that scientists have already observed. But, what does the future hold? How will the climate change in the future? Answering those questions is a challenge for scientists because of all of the variables that exist in predicting the future.
For starters, how will greenhouse gas concentrations change in the future? Will they level off quickly, level off later this century, or keep increasing at the current rate (or even faster)? The answer depends on technological advances, as well as economic, energy, and environmental policies set by politicians and governments around the world. As if predicting future weather and climate wasn't hard enough, predicting human behavior is even harder! So, to assess a range of possibilities, scientists consider various future scenarios for greenhouse gas emissions and concentrations (as well as air pollution and land-use changes).
Scientists call these possible future scenarios "Representative Concentration Pathways," and they're based on assumptions about future economic activity, population growth, etc., and their consequences for atmospheric composition. The possibilities range from a "best-case scenario" for limiting future warming, in which yearly greenhouse gas emissions decline to zero late this century, to a "worst-case scenario," in which yearly emissions continue to rise through the year 2100. The graph below shows the predicted future warming based on the best-case (labeled RCP 2.6 in the graph below) and worst-case (labeled RCP 8.5 in the graph below) scenarios.
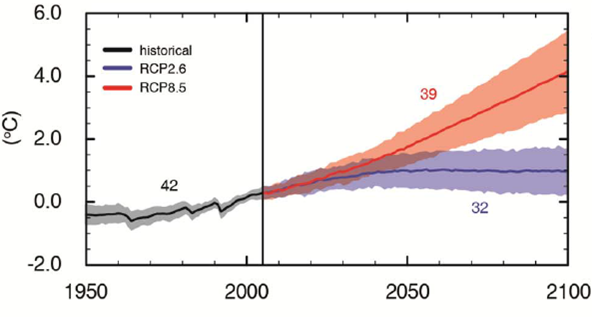
Note that severely limiting future greenhouse gas emissions leads to the least additional warming through 2100 (likely between 0.3 degrees Celsius and 1.7 degrees Celsius). Continuing to increase greenhouse gas emissions through 2100 leads to an additional warming likely between 2.6 degrees Celsius and 4.8 degrees Celsius. In reality, both of these scenarios (best- and worst-case) are less likely than some intermediate scenario (intermediate possibilities aren't shown on the graph), which would lead to some amount of warming in between these values. But where do these projections come from and how reliable are they?
In an ideal world, scientists could use an identical planet, just like Earth, to use as an experiment -- to compare observed changes to our climate to those without human influence on the identical planet. But, no such planet exists! Therefore, scientists have to use the next-best thing -- computer model simulations. Climate models are called general circulation models (GCMs), which use mathematical equations to simulate and predict atmospheric and oceanic motions and other processes. The basic equations to describe atmospheric motions and processes are actually the same as those in computer models used to predict short-term weather, but GCMs also include other equations to describe changes in greenhouse gas concentrations and other large-scale and long-duration oceanic processes. GCMs must include those equations because they're important for estimating trends in global average temperature over the course of a century, but short-term weather models can exclude them because they're insignificant when considering, say, a weather forecast a week into the future.
GCMs have become increasingly complex in the last few decades as computing power, and our understanding of some aspects of the earth-atmosphere system have improved. The graphic below pictorially describes the components included in climate models, and as you can tell, early GCMs in the 1970s were quite crude in their depiction of the earth, including only basic atmospheric processes and greenhouse gases. But, more recent GCMs (toward the bottom of the graphic) are far more sophisticated. They contain realistic representations of the land surface, oceans, ice coverage, and can simulate transfers of carbon and water between the earth and atmosphere. The most sophisticated GCMs include a "fully coupled" atmosphere and ocean, meaning that the atmosphere and ocean are "connected" in the model (changes in the atmosphere realistically affect the ocean and vice versa). These coupled GCMs are so sophisticated that they can only run on the world's fastest supercomputers.
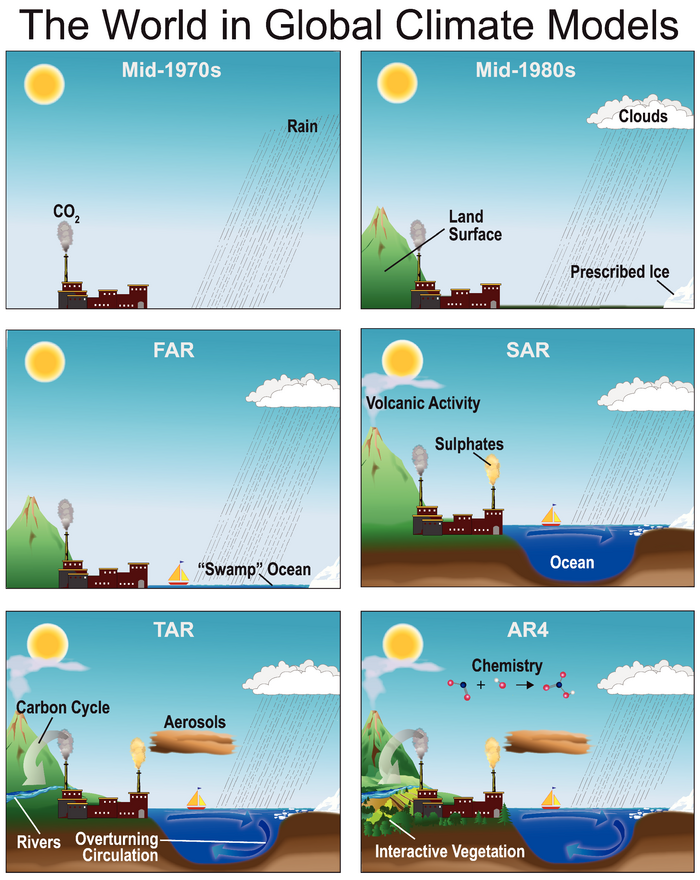
By the way, the acronyms, "FAR," "SAR," "TAR," and "AR4" in the image above refer to the state of GCMs at the times of the first, second, third, and fourth assessment reports of the Intergovernmental Panel on Climate Change, respectively. For perspective, the first assessment report (FAR) was published in 1990, and the fourth (AR4) in 2007. Since 2007, GCMs have become even more sophisticated, but even with the increasing sophistication of GCMs, the latest and greatest ones still can't match the true complexity of the real climate system.
So, if we have imperfect GCMs trying to predict the future, are the predictions accurate? After all, if weather forecasts from imperfect computer models can't accurately predict the weather two weeks in advance, how can a GCM accurately predict characteristics of the climate 100 years from now? That's a reasonable question! In reality, it's a bit of an "apples and oranges" comparison, though. Successful short-term weather forecasts require accurate predictions of the details of a weather pattern -- positions of high- and low-pressure systems, wind directions and speeds, exact temperatures at given times, locations of areas of precipitation, etc. Such predictions are highly sensitive to the initial state of the atmosphere. In other words, for a perfect prediction, the computer model must start out with a perfect picture of the current state of the atmosphere (exact wind, temperature, humidity, etc.) everywhere on Earth. Since we can't measure every inch of the atmosphere at all times, such perfection is impossible, and leads to errors in the weather forecast, which grow with time.
But, GCMs aren't trying to make such specific predictions about day-to-day weather features. They're trying to determine large-scale changes in climate (trends in temperature, melting ice, total amount of rainfall, etc.) over decades. Those predictions are much less sensitive to the current state of the atmosphere. In other words, how warm the climate is 100 years from now has very little to do with the exact wind direction or temperature today at any given location. So, small errors in the initial state of the atmosphere, which lead to errors in short-term weather forecasts, just don't have the same impact on GCMs.
Still, GCMs aren't perfect, and a quote from British statistician George Box comes to mind: "All models are wrong, but some are useful." In other words, GCM predictions are certainly imperfect, but they can still be helpful. One big cause of imperfections in GCMs relates to complexities in the ocean. Oceans, if you recall, are the world's largest reservoir of carbon, and they have absorbed roughly half of anthropogenic carbon dioxide emissions so far (helping to limit anthropogenic warming of the atmosphere). But, as the ocean takes on more carbon dioxide, its ability to continue absorbing it is diminished. The rate that it diminishes depends on complex interactions in the ocean that aren't perfectly modeled. But, this somewhat uncertain ocean behavior, along with the oceans' large heat capacity, will play a key role in the rate of future atmospheric warming.
Another "trouble spot" in GCMs is clouds and water vapor. Remember that clouds affect temperature by both blocking incoming solar radiation during the daytime (a cooling effect), and also efficiently absorbing and emitting infrared radiation (a warming effect). The effect that wins out largely depends on the types of clouds that dominate, and as the world warms and evaporation from warmer oceans increases, concentrations of atmospheric water vapor (the most abundant greenhouse gas) will increase. Increased water vapor will likely also lead to more cloud cover, but what types of clouds will dominate? Will their warming or cooling effect win out overall? The answers are unclear, and serve as another source of uncertainty in future projections.
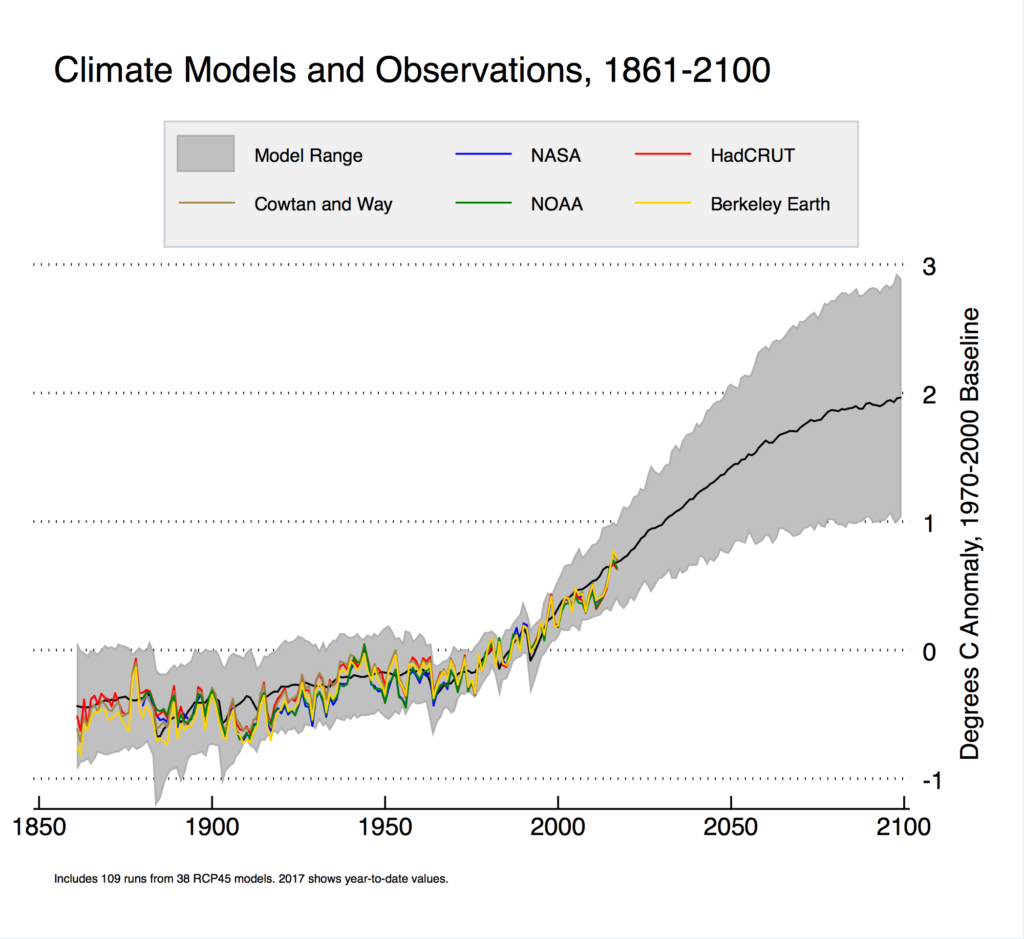
As a result, scientists take different approaches to tackling these and other uncertain aspects of future climate by running various versions of GCMs to create a range of future possibilities, indicated by the gray shaded area in the graph above. The black line marks the average of all of the model forecasts. To get an idea of how well these models perform, scientists run "hindcasts" to see how well the model-simulated climates compare to actual observations from the past (observations from the major surface temperature records are marked by the various colored lines on the graph above). If the model is able to simulate the climate of the past reasonably well, then scientists have more confidence that its projections will be useful.
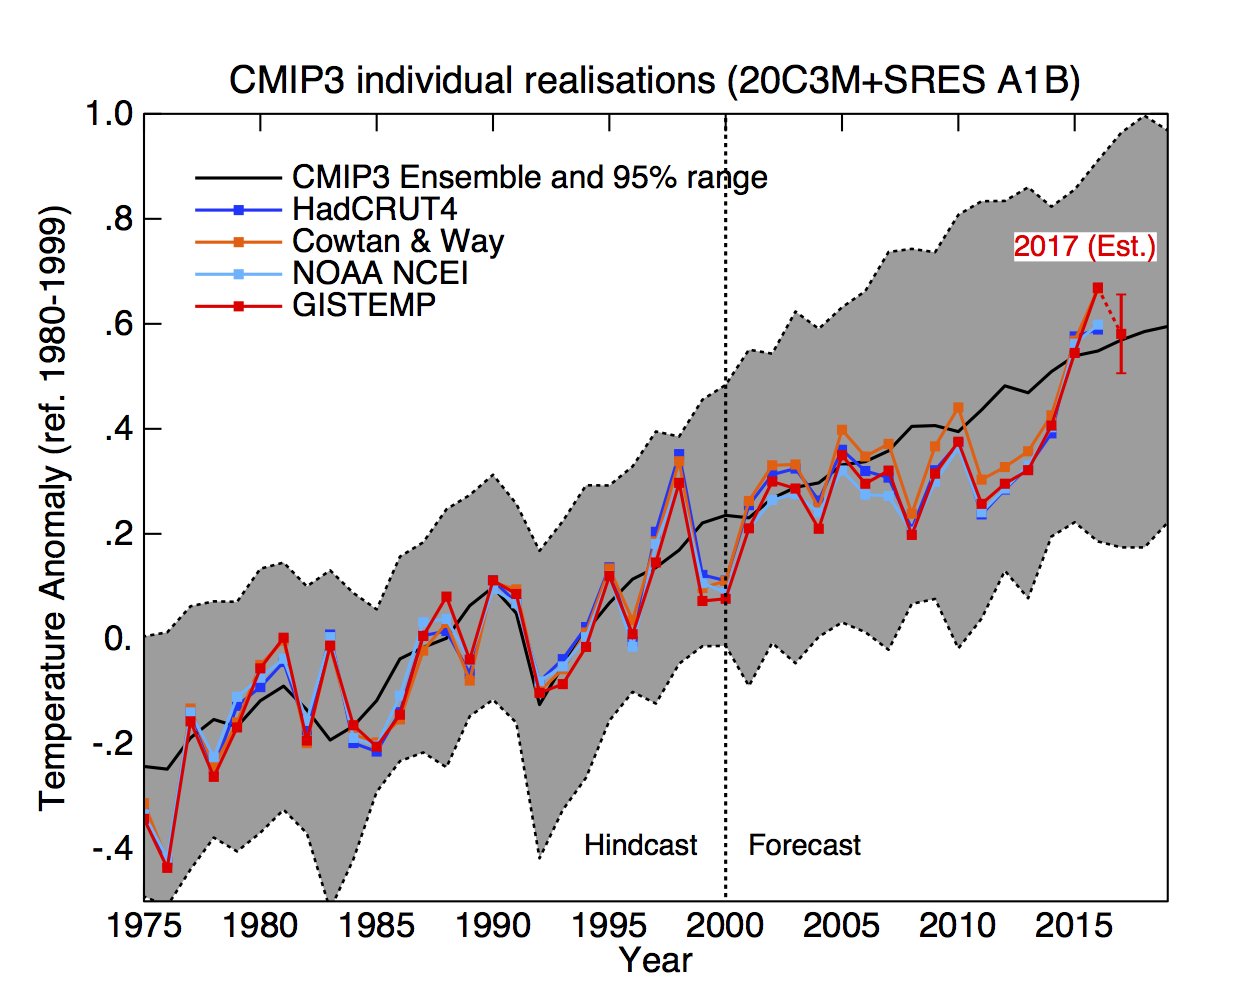
Note a few important messages from the graph above. First, climate models don't necessarily handle the short-term temperature spikes and dips very well (which rely on various ocean cycles, volcanic eruptions, etc.). But, in the scheme of long-term climate change, those little "wiggles" aren't particularly important. The trend over decades to centuries is what scientists are more interested in, and climate models have performed fairly well in getting the trends right. If we look back at older climate model simulations (credit: Gavin Schmidt), we can see that the warming that has occurred since 2000 has been within the range of projections from the climate models of the era.
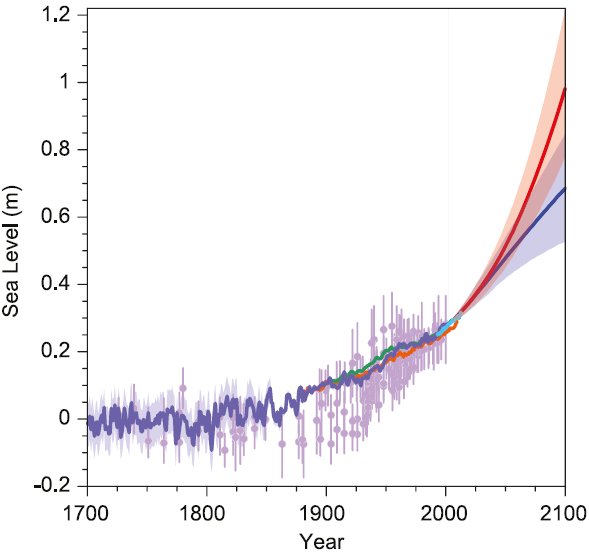
So, the strong message from climate models is that the world will very likely continue warming through 2100, although there's some uncertainty about just how much. Additional warming, of course, has consequences for many of the observed trends that we've already discussed in this lesson (melting ice, sea-level rise, and even extreme weather). For example, climate models predict sea-level increases (credit: Intergovernmental Panel on Climate Change) ranging from about a half meter (about 1.5 feet) to about one meter (a little more than 3 feet) by 2100, depending on future greenhouse gas emissions and additional warming. These are global averages, of course, and there's less skill in regional predictions. This is also true for extreme weather predictions. While GCMs suggest further increases in extreme heat episodes (and reductions in extreme cold), more heavy rain events and an increased intensity of tropical cyclones, they don't have much skill in describing where these trends may be felt the most (or the least). In other words, climate models aren't yet skillful at making detailed local predictions about how the weather at your hometown or in your state may change over the next 100 years.
If the state of the climate for the next 100 years depends on human activity, what are we to do? That question is the source of most of the debate surrounding climate change, because potential solutions affect worldwide economic, energy, and environmental policies. Taking quick, far-reaching actions to reduce greenhouse gas emissions and limit future warming would require major policy and lifestyle changes in the developed world. On the flip side, doing nothing will likely cause a future warming toward the higher end of projections, which will likely cause the greatest strain on communities and infrastructure. Society can also act incrementally to reduce greenhouse gas emissions by increasing energy efficiency, reducing fossil fuel usage, and increasing the use of alternative energy sources like wind and solar power. Some liken such actions to "buying insurance" to protect against the worst potential consequences of global warming (spend some money now to protect against spending a lot more money later in dealing with the worst consequences). While we're not going to spend much time discussing various solutions, before we end the lesson, I want to cover one historical case when society essentially chose to "buy insurance" to protect against a harmful environmental change. Up next, we'll talk about the ozone layer.