Prioritize...
At the completion of this section you should be able to describe trends in ocean temperature, ocean acidification, global ice coverage, and sea level. You should also be able to define ice sheets and sea ice, discuss their respective contributions to sea-level rise, and discuss the consequences of sea-level rise.
Read...
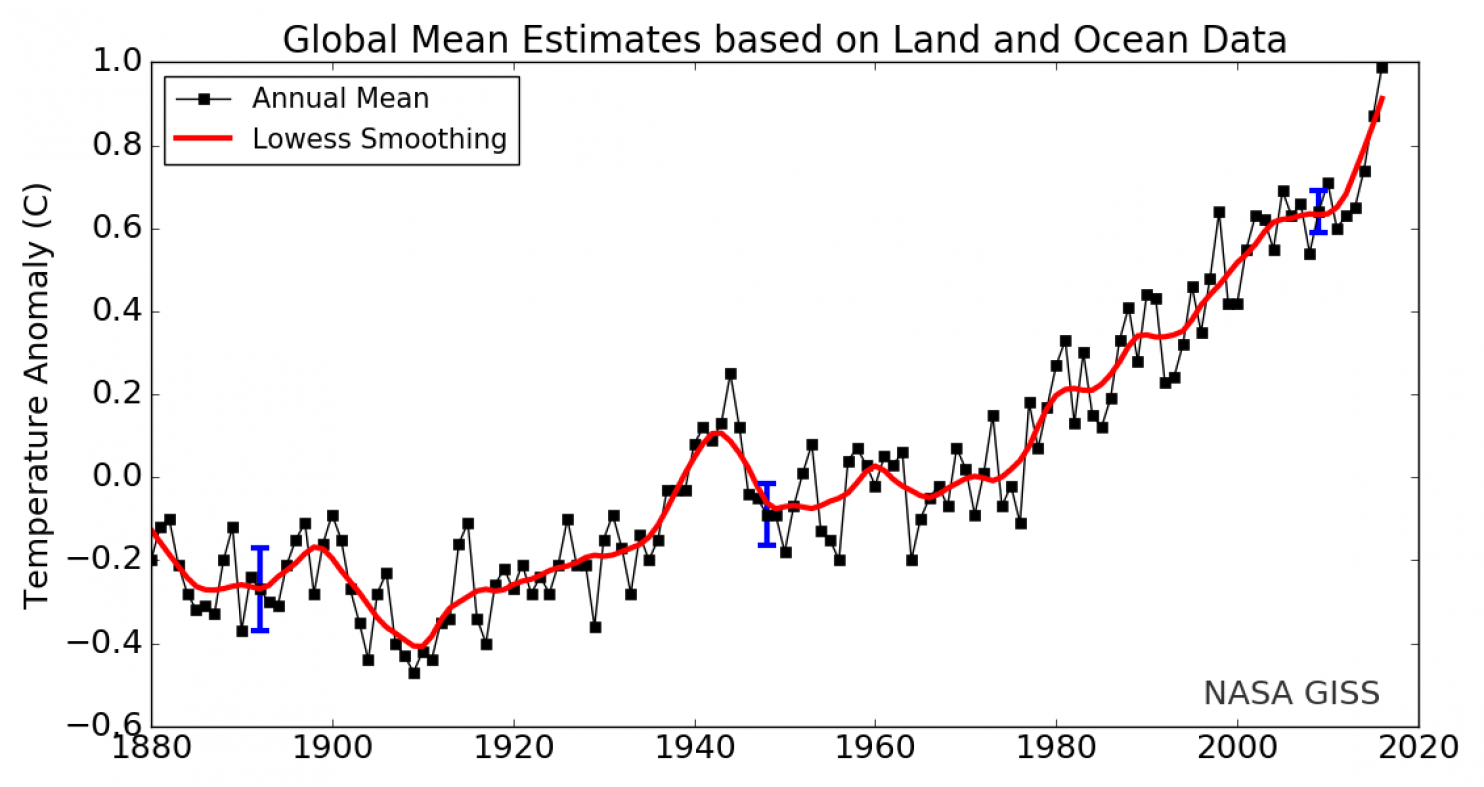
Since the late 1800s, global average temperatures have increased by a little more than 1 degree Celsius (about 2 degrees Fahrenheit). That doesn't sound like much, so what's the big deal about a little warming, especially if, in the past, Earth has been warmer than it is now? That's a reasonable question! The recent warming stands out because temperatures since the end of the last ice age (around 10,000 years ago) have likely varied by only about 1.7 degrees Celsius (about 3 degrees Fahrenheit). So, the rate of the warming (more than a degree Celsius in about a century, with much of it coming after 1980) really stands out as unusual.
Furthermore, when the earth was last this warm (or warmer), it wasn't inhabited by more than 7 billion people, and humans hadn't yet built extensive infrastructure across most of the continents. Humans have made decisions about the evolution of society (city growth, infrastructure needs, agricultural activities, etc.) based on the climate of the past several centuries, and a continued warming of the earth means that the climate characteristics that modern society was built upon will change. And, while a temperature increase of a few degrees may still seem like no big deal, allow me to use an analogy. Normal human body temperature is 98.6 degrees Fahrenheit. But, if your body temperature increases by just 2 or 3 degrees Fahrenheit, you have a fever and feel sick. Sometimes seemingly small changes can be important! With that in mind, let's explore some of the major changes that are occurring along with the rise in global atmospheric temperatures.
Ocean Warming and Acidification
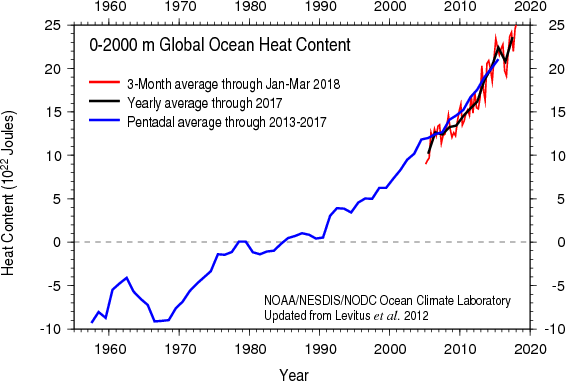
For starters, the atmosphere isn't the only part of the earth system that's warming. The oceans are, too. The graph below shows global ocean "heat content" from the ocean surface down to a depth of 2000 meters since the late 1950s. It turns out that much of the excess energy resulting from a strengthening greenhouse effect is actually being absorbed by the oceans. As a result, the oceans have also warmed, although not quite as much as the atmosphere because, if you recall, water has a much higher heat capacity than air (it takes more energy to warm water than an equivalent volume of air).
But, not only are the oceans warming, they're also becoming more acidic. Remember that the oceans are the largest reservoir of carbon on earth, and increasing amounts of carbon dioxide are being transferred from the atmosphere to the ocean. When carbon dioxide is dissolved in ocean water, carbonic acid forms, and with increased carbonic acid formation, ocean water is very gradually acidifying. On one hand, photosynthetic algae may benefit from from the increased carbon availability in the ocean since they rely on carbon dioxide for photosynthesis. But, on the other hand, the changing chemistry of ocean water negatively affects species like oysters, clams, sea urchins, various corals, and species that are vital parts of the food chain for larger fish. With about a billion people worldwide using food from the ocean as a primary source of nutrition, the health of fish and other species in the ocean is an important economic and food security issue.
Melting Ice
Not surprisingly, as the world has warmed, the amount of ice in polar regions has declined. In particular, it's warm enough to melt ice in the Arctic for a longer period of time during the year, leading to declining ice coverage, thickness, and volume. Scientists are keeping tabs on two main "types" of ice -- sea ice and ice sheets. Sea ice is simply frozen ocean water. Areas of sea ice tend to grow during the winter and shrink during the summer due to melting. Since 1979 (when satellite observations of sea ice began), Arctic sea ice has notably declined. Scientists often compare each year's minimum extent, which typically occurs in September in the Arctic, to decipher trends. As shown in the animation below, September sea ice extent in the Arctic has declined by about 13 percent per decade since 1979. Also note that, much like with global temperatures, there are some ups and downs -- short-term fluctuations driven by natural variability, but the overall trend is certainly downward.
Longer-term reconstructions of Arctic sea ice, like this animation showing Arctic sea ice concentration between 1914 and 2013 (credit: Zachary Labe) puts the recent decline in perspective. What are some consequences of the decline in Arctic sea ice? Well, for starters, less ice means lower albedo for the Arctic region as a whole, leading to additional warming from increased absorption of solar radiation. A warming Arctic with less sea ice also has the potential to alter temperature gradients across the Northern Hemisphere (temperature differences between the poles and equator), which as you know can affect the development of mid-latitude low-pressure systems and atmospheric circulation patterns.
Shrinking areas of sea ice also mean that the Northwest Passage (the shortcut route from the Atlantic Ocean to the Pacific Ocean through the Arctic) more frequently becomes ice free, and can be a more viable route for commercial shipping during late summer. While having such an ice-free shortcut can have economic benefits, more open routes for ships also bring about security concerns, which have the attention of the United States Navy, in particular. In 2014, the Navy issued their "Arctic Roadmap" through 2030 (NOTE: not required reading), which outlines how the Navy plans to deal with the consequences of increasing open waters in the Arctic. In case you're wondering, the Antarctic region also has sea ice, but it typically grows and disappears nearly completely each year with the changing seasons.
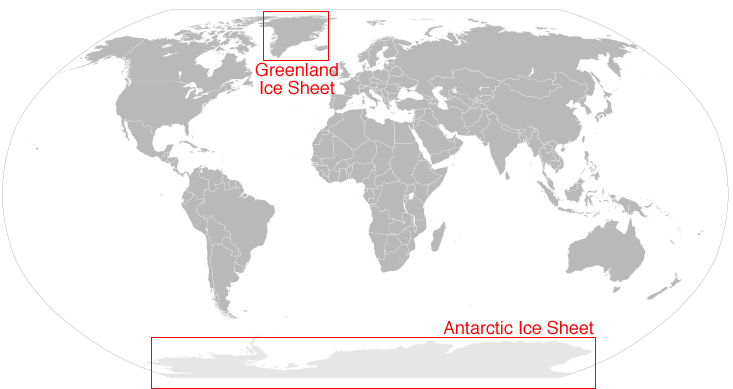
Moving out of the sea, ice sheets are huge masses of "glacial" ice on land, which cover at least 50,000 square kilometers (20,000 square miles). For the record, "glaciers" are merely old masses of ice on land that aren't as big as ice sheets. Ice sheets tend to grow over time as snow falls, and then never fully melts during the summer season. This allows new snow to fall on top of the "old" snow the following winter, compressing it, and as this cycle repeats itself over hundreds to thousands of years, large masses of ice can grow. Today, Earth has two ice sheets -- Greenland and Antarctica (credit: NSIDC), which contain about 99 percent of the world's freshwater ice. During the last ice age, these ice sheets were much larger. The Greenland ice sheet, for example, covered much of North America and Northern Europe.
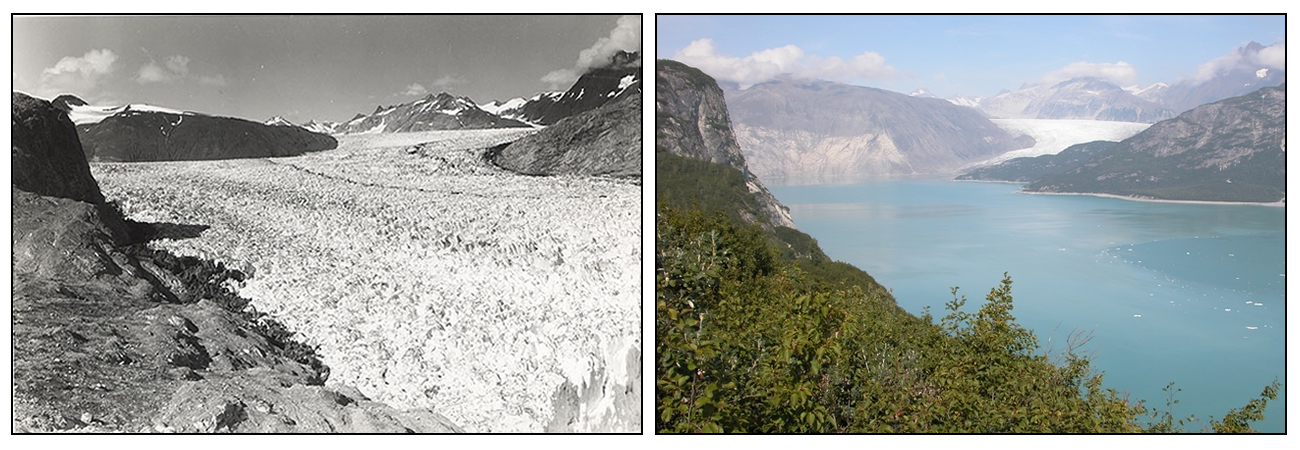
But, as the world warms, the Greenland and Antarctic ice sheets are also melting. Scientists began tracking these ice sheets via satellite in 2002, and you can see the trends in land-ice mass in these side-by-side graphs (credit: Zachary Labe). Note that the Greenland ice sheet is melting more rapidly than the Antarctic ice sheet, in large part because the high latitudes of the Northern Hemisphere (where Greenland is located) are warming faster than anywhere else on the planet. As a result, in addition to the Greenland ice sheet, high-latitude glaciers in the Northern Hemisphere are melting, too (check out the side-by-side photos of Alaska's Muir Glacier in 1941 [left] and 2004 [right] below).
All in all, ice on land and in the water is melting much faster in the Arctic than it is in the Antarctic, where less warming has occurred and some Antarctic ice shelves (floating masses of ice attached to a land mass) have actually grown slightly. But, when sea ice melts, the impacts on sea level are rather small because the ice was already in the ocean (like ice cubes floating in a cold beverage). The same goes for ice shelves. Melting ice sheets and glaciers on land, however, are another story.
Sea-Level Rise
Melting ice sheets and glaciers on land are a big concern because they contain such large amounts of fresh water, and when they melt, that water has to go somewhere. Much of the melted fresh water ends up in the ocean. For example, after the end of the last ice age, melting ice sheets and glaciers caused global sea level to rise by about 400 feet (about 120 meters) up until about 5,000 to 6,000 years ago. After that point, sea level didn't change much until the modern day melting began, which the observational data picked up on starting in the late 1800s. Just how much could sea levels rise if the existing ice sheets melted entirely? Well, scientists estimate that if the entire Greenland ice sheet melted, enough fresh water would pour into the ocean to increase sea level by about 20 feet (about 6 meters). If the entire Antarctic ice sheet melted, sea level would rise by roughly 200 feet (about 60 meters). Such melting would drastically reshape our planet!
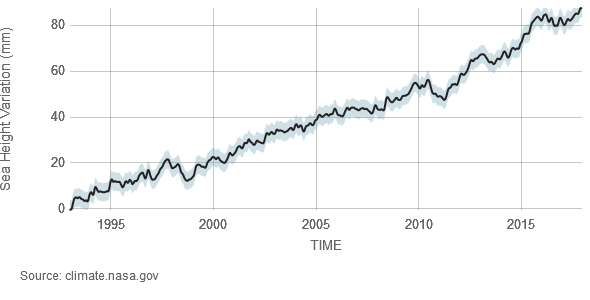
We're a long way from that happening, since the Greenland ice sheet still covers more than 600,000 square miles (more than three times the size of Texas) and the Antarctic ice sheet covers more than 5 million square miles (about the area of the contiguous United States and Mexico combined). Still, the melting that has occurred is already contributing to a rise in sea level. Since 1993 (when the satellite record for tracking sea level began), sea level has risen by more than 80 millimeters (more than 3 inches), as shown in the graph below. A longer-term record, using tidal gauges, indicates that increasing sea levels began before 1993, and all told, global sea level has risen by nearly 10 inches since the late 1800s.
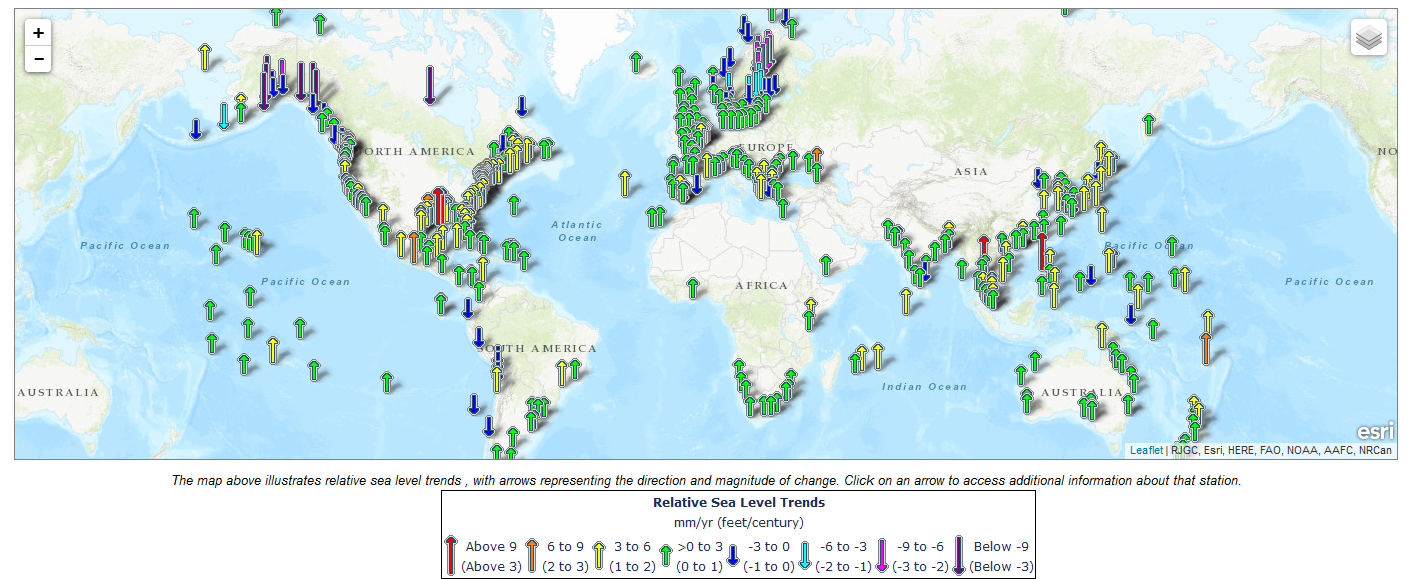
Much of the rise can be attributed to melting ice sheets and glaciers, but thermal expansion of the warming ocean waters is contributing, too (water expands slightly when it warms). As with trends in atmospheric temperature, complexities exist, however. For starters, there are short-term ups and downs (each year doesn't always have a higher mean sea level compared to the prior year), and sea levels aren't rising equally everywhere. Variations in ocean currents and local geography mean that sea levels in some parts of the world are rising more quickly than the global average, while in other areas sea levels have fallen or are remaining steady, even while the global average sea level increases. This graphic from NOAA will give you an idea of where sea levels are rising and falling along the world's coasts. Furthermore, natural geologic factors affect sea level, too, such as the fact that the basins that hold Earth's oceans are constantly (albeit very slowly) changing shape, so scientists must take these long-term natural factors into account when calculating the rate of sea-level change due to global warming.
While a global average sea-level rise of 10 inches since the late 1800s may seem like no big deal, consider that 11 of the world's 15 largest cities are along coastlines. In the United States alone, about 40 percent of the population lives in densely-populated coastal areas. Even with the sea-level rise that has occurred so far, low-lying coastal areas of some large cities are flooding more frequently. Already in Miami, Florida, the highest tides of the year (called "king tides") are increasingly causing flooding in parts of the city. Estimates show that king-tide flooding in Miami Beach has increased by four times since 2006. So, what may seem like a slow and minor sea-level rise is starting to have local and regional economic impacts. Continued warming and sea-level rise will likely cause more areas (and people) along the world's coastlines to become increasingly vulnerable to flooding.
I've only covered some of the major (and fairly straightforward) consequences of a warming planet, but one that I didn't touch on in this section is how the warming of the planet is impacting weather patterns and extreme weather in particular. I'll cover that next. Read on!