Prioritize...
When you finish this page, you should be able to discuss temperature, dew point, visibility, and their units of measurement. You should also be able to identify and interpret temperature, dew point, visibility, and present weather (obstructions to visibility) on a station model.
Read...
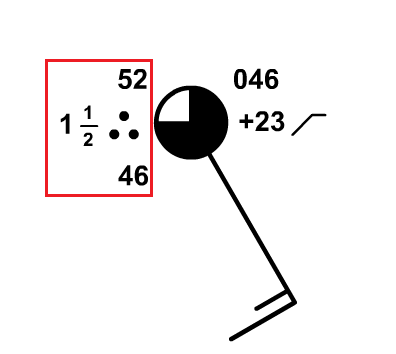
For meteorologists, the first step in studying the atmosphere is making observations. Commonly, meteorologists display these observations in something called a station model (check out the example on the right), which is a graphical template showing current weather conditions at a weather station (often located at an airport). Over the next couple of sections, I'm going to introduce you to the key variables displayed on the station model and show you how to interpret one. On this page, we're going to focus on temperature, dew point, visibility, and "present weather" (obstructions to visibility), which I've put in a red box in the station model on the right.
I'll briefly discuss each variable (what it is and its common units of measurement), and then I'll discuss how you can interpret each one on a station model. Let's start with something I'm sure you're familiar with--temperature.
Temperature: While you probably think of temperature as "how hot or cold something is," that's a pretty ambiguous definition (since "hot" and "cold" are somewhat subjective). More precisely, temperature is a measure of energy. You see, air molecules are restless little lumps of matter, continually vibrating, wriggling and bumping into their many neighbors. As air temperature increases, the molecular dance becomes increasingly frenetic. At a temperature of 72 degrees Fahrenheit, the average speed of air molecules is about 1,000 miles an hour, which translates into ample kinetic energy (energy of motion). Thus, air temperature is a measure of the average kinetic energy of air molecules.
In the United States, we typically express temperature using the Fahrenheit temperature scale, but most countries in the world use the Celsius temperature scale (undoubtedly, you've heard temperature expressed in "degrees Fahrenheit" or "degrees Celsius" before). By the way, if you ever need to convert between the two scales, the National Weather Service temperature conversion calculator is great!
To give you some weather context, the North American all-time marks for highest and lowest temperatures are, respectively, 134 degrees Fahrenheit (56.7 degrees Celsius) in California's Death Valley, and minus 81.4 degrees Fahrenheit (minus 63 degrees Celsius) at the village of Snag in the Yukon Territory of Canada. You may also be familiar with some (non-weather) common temperature markers:
- 100 degrees Celsius (212 degrees Fahrenheit) is the boiling point of water
- 37 degrees Celsius (98.6 degrees Fahrenheit) corresponds to normal body temperature
- 22.2 degrees Celsius (72 degrees Fahrenheit) represents the "ideal" room temperature
- 0 degrees Celsius (32 degrees Fahrenheit) is the melting point of ice
There are other temperature scales besides Celsius and Fahrenheit. For example, there's the Kelvin scale (sometimes called the "absolute temperature scale"). Please note that the number of kelvins = the number of degrees Celsius + 273.15. So, the melting point of ice is 273.15 kelvins and the boiling point of water, at standard pressure, is 373.15 kelvins. For the record, it's bad form to say "degrees kelvin." Indeed, the proper way to express the units of absolute temperature is simply "kelvins." The Kelvin scale is used commonly in the physical sciences, and in fact it's the most direct way to describe the relationship between the average speed of air molecules and their temperature (higher temperatures = faster average molecule speeds).
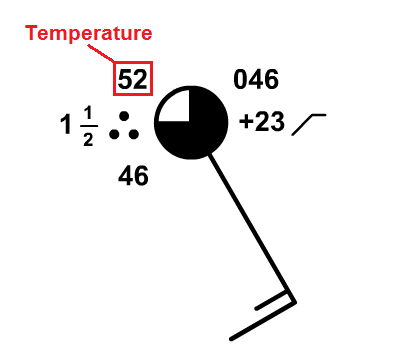
On a station model, reading the temperature is pretty easy. The number located in the upper-left corner of the model is the station temperature expressed in degrees Fahrenheit (or Celsius, depending on the country of origin). In the case of the station model on the right, the temperature is 52 degrees Fahrenheit. Unless otherwise indicated, you can assume in this course that we're using degrees Fahrenheit on the station model.
Dew Point: By definition, the dew point is the approximate temperature to which the water vapor (the gaseous form of water) in the air must be cooled (at constant pressure) in order for it to condense into liquid water drops. We're going to talk a lot more about dew point later on, but for now, focus on the fact that dew point is a temperature, so it's typically expressed in degrees Fahrenheit or Celsius.
As it turns out, the dew point temperature is also an absolute measure of the amount of water vapor present. The higher the concentration of water vapor, the higher the dew point, and by itself, the dew point serves as an indicator of the way the air “feels” – whether it be dry or muggy. Since our skin temperature is regulated to some degree by evaporation of sweat, it would be logical that we would be affected to some degree by the dew point temperature. Certainly, describing how something “feels” can be a bit dicey in a science course because it’s a somewhat subjective topic, but examine the table below for a rough guide on how the air might “feel” based on dew point temperature.
| Dew Point | General level of comfort |
|---|---|
| 60 degrees | For most people, the air starts to feel a tad "muggy" or "sticky." |
| 65 degrees | The air starts to feel "muggy" or "sticky." |
| 70 degrees | The air is sultry and tropical and generally uncomfortable. |
| 75 degrees or higher | The air is oppressive and stifling. |
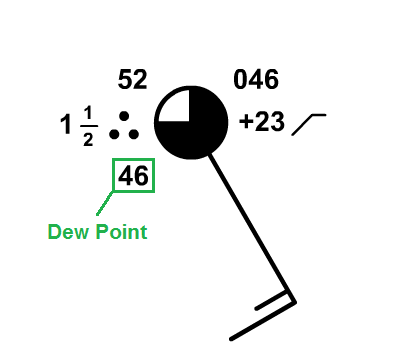
Finding the dew point on a station model is also pretty easy. The number located in the lower-left corner of the model is the station dew point in degrees Fahrenheit (or Celsius, depending on the country of origin). In the case of the station model on the right, the temperature is 46 degrees Fahrenheit.
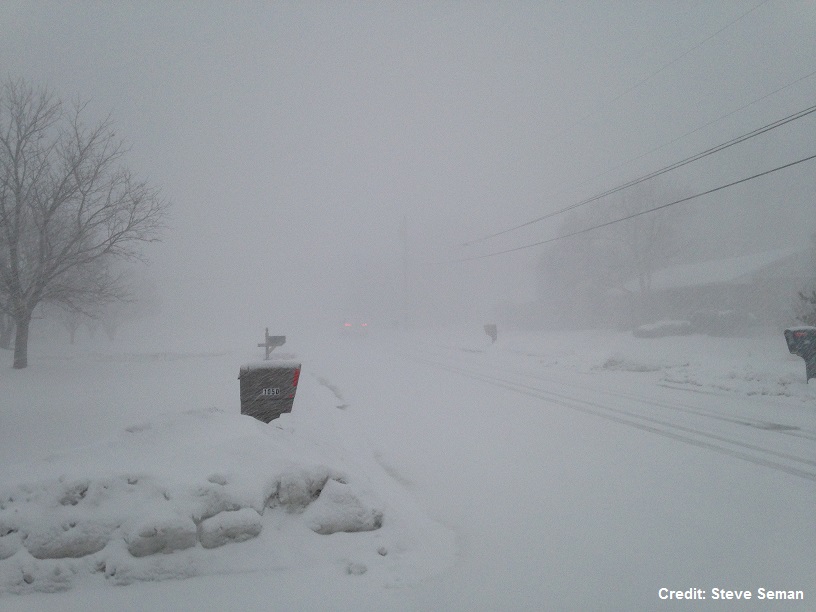
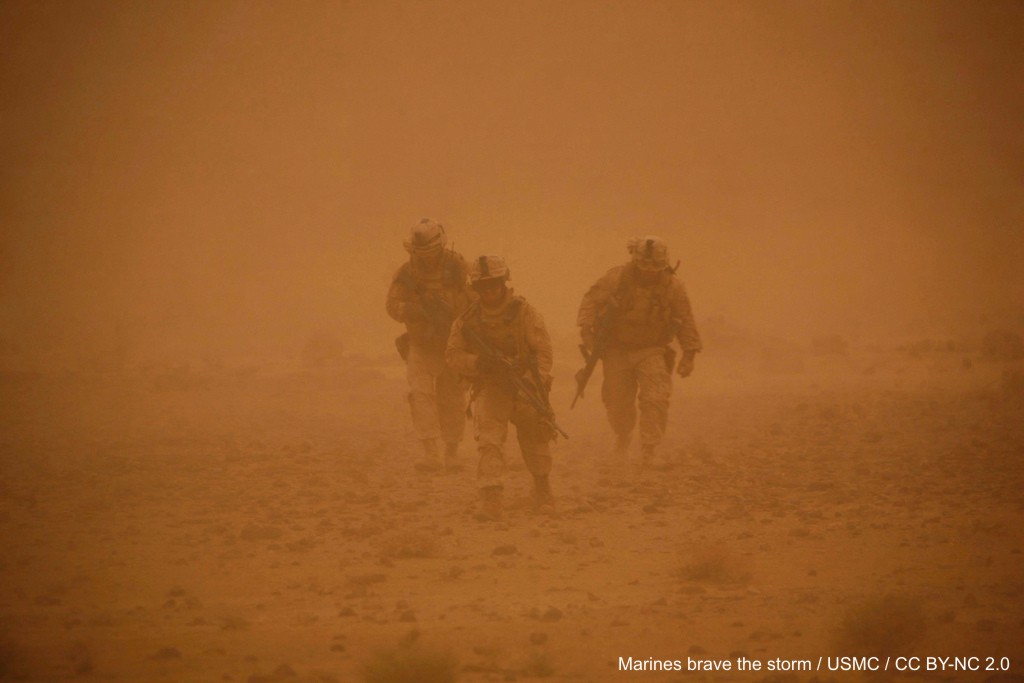
Visibility and Present Weather: I'm going to cover these two observations together, since they're highly related. Meteorologists are very interested in the horizontal visibility (essentially, how far you can see) because it has major implications for transportation. If visibility is very low, conditions can be quite hazardous for drivers or landing aircraft!
Horizontal visibility can run the gamut. On a perfectly clear day, you can't see forever, but visibility can reach approximately 100 miles in the mountainous western U.S. On the other hand, visibility can lower to near zero in heavy, "pea-soup" fog, fierce blowing and/or falling snow, blowing sand/dust, smoke, etc. On a station model, the visibility is expressed in miles in the United States (you can assume we're using miles in this course, unless noted otherwise), and is located below and to the left of the temperature.
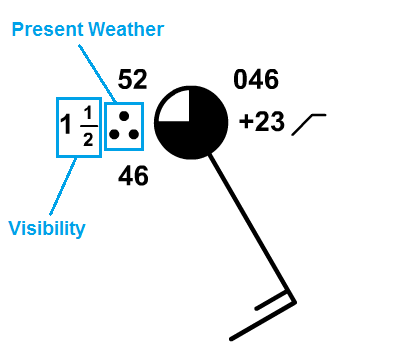
On the annotated station model to the right, I've labeled the visibility (1 1/2 miles, in this case). Please note, however, that if visibility is not greatly reduced, it is often omitted from the station model. However, if visibility is reduced to seven miles or fewer, the offending obstruction to visibility ("present weather") is also included in the station model, immediately to the right of the visibility and just below the temperature. While there are many, many possible symbols, here are the most commonly used symbols for present weather. In the sample station model to the right, the three "dots" indicate that moderate rain was the culprit, reducing visibility to one-and-a-half miles. If you're interested, here's a very comprehensive list showing the wide variety of possible present weather symbols (although some of these very rarely get used).
Because of the varying degrees that precipitation can reduce horizontal visibility, the qualifiers of light, moderate, or heavy are added (such as "light rain" or "heavy snow"). I should also note that if precipitation is falling, it is always reported on the station model, no matter how light or how little it affects visibility. But, as I mentioned before, non-precipitating obstructions to visibility (fog, haze, and smoke are perhaps the most common) are only reported in the station model when visibility drops to seven miles or fewer.
Ultimately, while you don't need to memorize every single symbol for present weather, you should spend some time familiarizing yourself with the common ones, and you should certainly memorize the location of temperature, dew point, visibility, and present weather on the station model. To help you get started, take some time to examine the Key Skill box below.
Key Skill...
Below in an interactive station model that allows you to input your own data, and the station model will adjust, so you can see how it looks. The tool includes some parts of the station model that we haven't talked about yet, but for now, focus on changing the temperature, dew point, visibility, and obstruction to visibility (present weather) to see how the station model changes. This will help you cement where each of these is located on the station model, and help you become familiar with the common symbols for present weather.
You can also look at the most current surface observations and you should be able to pick out the temperature and dew point at each station (many may not have visibility or present weather plotted).