Prioritize...
When you finish this page, you should be able to:
- discuss sky coverage (fraction of cloud cover) and interpret it on a station model
- apply the standard convention for expressing wind direction in meteorology, as well as interpret wind direction on a station model
- interpret wind speed on a station model.
Read...
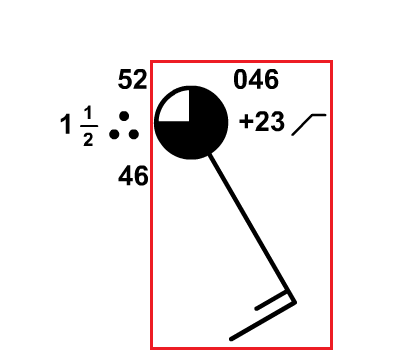
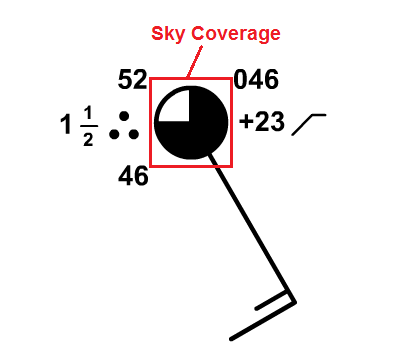
We're going to continue tackling the information contained in the station model, and now we're going to turn our attention to cloud coverage and wind direction and speed. I've outlined the part of the station model that includes this information in the sample on the right, but note that the station model also includes information about air pressure, which we'll mostly ignore for now and come back to later on. As I did with temperature, dew point, visibility, and present weather, I'll briefly describe each variable and its common units of measurement (if applicable), and then describe how to interpret it on a station model. Let's start with sky coverage:
Sky Coverage: Sky coverage simply describes the portion of the sky covered by clouds. Let me start with the age old question: "Which phrase do you think describes a cloudier sky? Partly sunny or partly cloudy?" The National Weather Service defines partly sunny and partly cloudy as essentially the same, with the caveat that we wouldn't use "partly sunny" at night, of course. But, in practice, some forecasters use these terms differently because the word "partly" is somewhat vague, so it's not clear cut. Some folks use "partly sunny" to emphasize that there will be a bit more clouds than sun, and use "partly cloudy" to emphasize that there will be a bit more sun than clouds. With this usage, a partly sunny day is actually cloudier than a partly cloudy day.
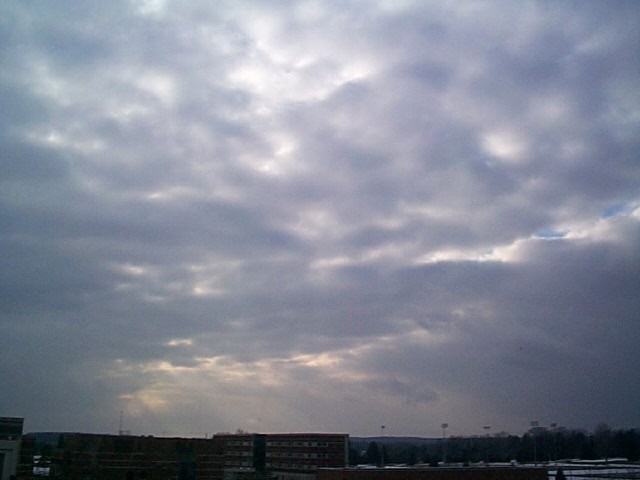
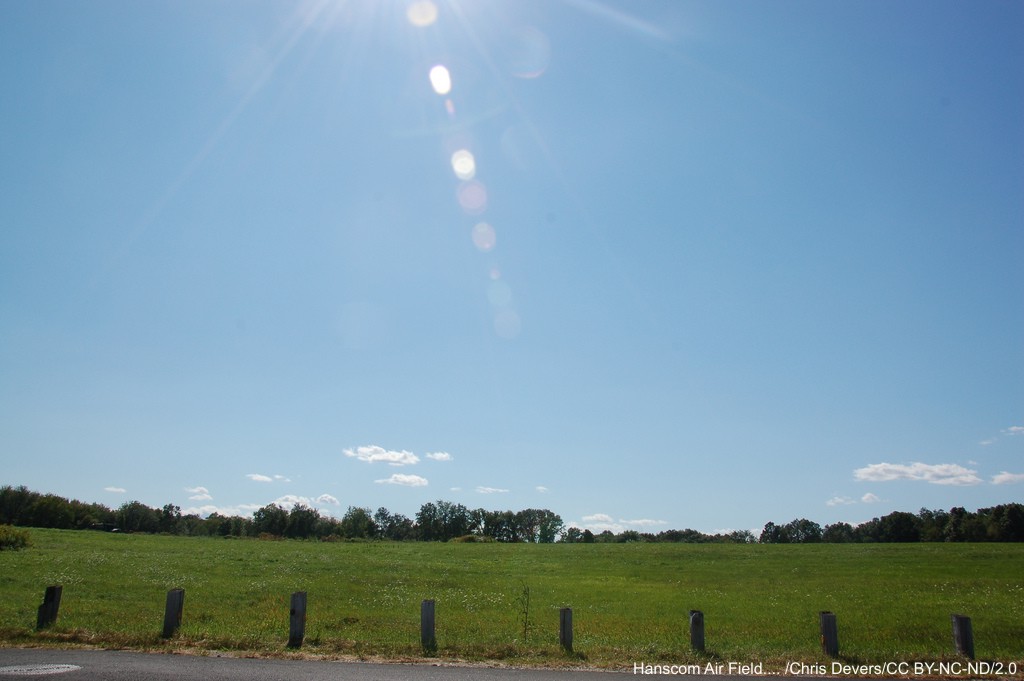
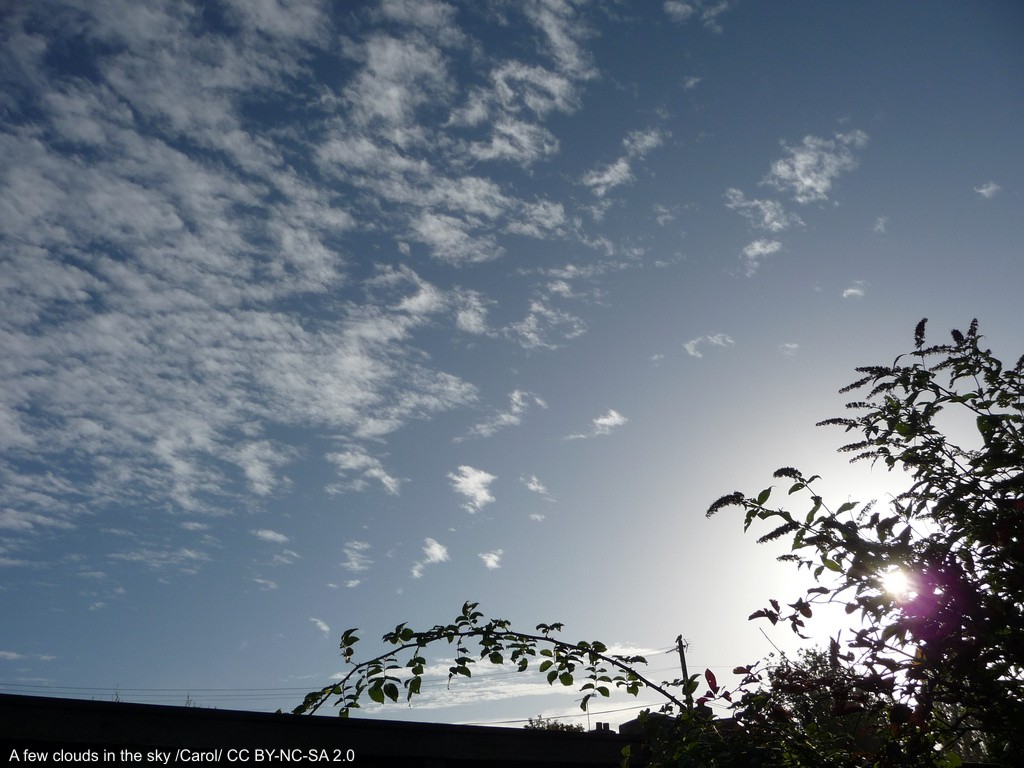
Most weather forecasters don't want to get drawn into such an argument of semantics, so when it comes to quantifying the coverage of the sky by clouds, they rely on a specific "pie-chart" system that leaves little room for debate (see table below). The "pie" that makes up the sky coverage observation is divided into 8 sections. Clear conditions (0/8 cloud coverage) constitute a perfectly sunny sky, while a "few" clouds (1/8 to 2/8 coverage) represent mostly sunny conditions. "Scattered" clouds (3/8 to 4/8 cloud coverage) correspond to a partly cloudy or partly sunny sky, with "broken" clouds (5/8 to 7/8 cloud coverage) describing a partly cloudy or partly sunny (5/8 coverage) to mostly cloudy (6/8 to 7/8 coverage) sky. When the sky is nearly overcast except for a few breaks, forecasters refer to the cloud coverage as breaks in the overcast (abbreviated as "BINOVC"). Picturing "overcast" conditions (8/8 coverage) is straightforward. When the sky is broken or overcast, weather observations will include the corresponding cloud ceiling, which is simply the height of the base of a broken or overcast layer of clouds. Cloud ceiling is not included in the station model, but it is particularly important for airplane pilots.
| Official Sky Cover Categories | Fractional Coverage | Plain-Language Descriptions |
|---|---|---|
| CLEAR | 0/8 | Sunny (or clear) |
| FEW | 1/8 - 2/8 | Mostly Sunny |
| SCATTERED | 3/8 - 4/8 | Partly Cloudy or Partly Sunny |
| BROKEN | 5/8 - 7/8 | Partly Cloudy or Partly Sunny (5/8) to Mostly Cloudy (6/8 or 7/8) |
| OVERCAST | 8/8 | Cloudy (or overcast) |
| SKY OBSCURED | (no fraction) | The weather observer can't determine the coverage or ceilings of clouds because low-level fog, haze, or smoke obscures the sky. |
Interpreting sky coverage on the station model is fairly intuitive, as the circle in the station model serves as the "pie chart" that shows the cloud coverage. The greater the cloud coverage that exists, generally the larger the portion of the circle that is filled in. In the sample station model below on the right, the circle is mostly filled in, corresponding to a "mostly cloudy" sky with 6/8 cloud coverage.
I should add that on occasion, the sky cover cannot be seen due to a low-level obstruction such as heavy fog, heavy rain, blowing snow, etc. In such cases when the observer cannot determine the sky coverage, the condition "sky obscured" is reported. The station model is thus marked with an "X" in the sky cover circle to designate that an obstruction prevents the weather observer from observing the rest of the sky. Even if the observer is fairly confident that the sky is overcast, if the ceiling cannot be observed, "sky obscured" would still be reported. Also, when sky obscured conditions exist and vertical visibility is very low, you'll sometimes see references to an indefinite ceiling. This simply means that the surface obscuration (such as heavy fog, blowing snow, etc.) has limited vertical visibility to the point that the cloud ceiling can't be determined.
Wind Direction: Wind is the horizontal movement of the air, and one of the most fundamental rules that you need to know is that the direction of the wind is always expressed as the direction FROM which the wind blows and NOT the direction toward which the wind blows. Make sure to commit that to memory! So, if the wind blows from the north, for example, you'll hear a meteorologist say that the wind is "northerly" (or there's a "north" wind), NOT a "southerly" or "south" wind. Meteorologists are always interested in where the air is coming from because it can help with weather forecasting. For example, if a wind is blowing from a region of warm air toward a region of colder air, a weather forecaster would want to know that!
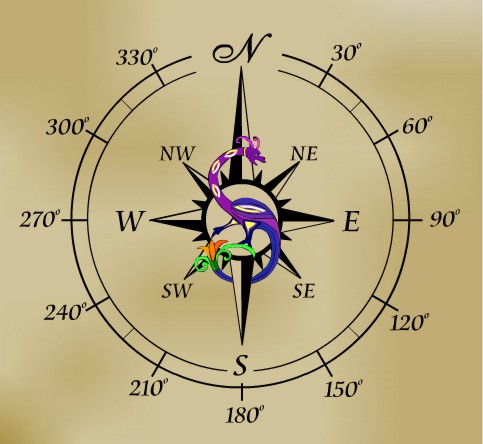
So, wind direction is always the direction from which the wind is blowing. Rather than brand the wind with a general direction such as "north" or "southeast," weather forecasters routinely use standard compass angles to fine-tune the wind direction. For sake of illustration, the wind direction from the north blows from a direction of 0 degrees. A wind that blows from the east is a 90-degree wind, while a wind direction of 70 degrees corresponds to a wind that blows from the east-northeast.
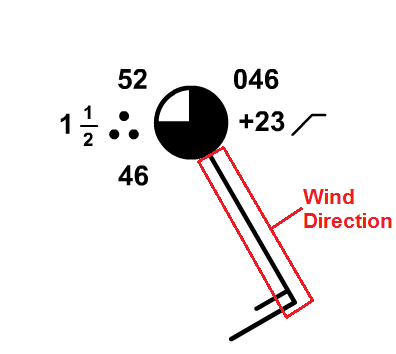
On a station model, the thin, solid line (often referred to as the "flag") extends outward from the sky coverage symbol in the direction that the wind is blowing from. In the example on the right, I've highlighted the wind "flag." Can you tell what the wind direction is on this station model? Remembering that wind direction is the direction that the wind is blowing from, it's apparent that the wind is blowing from the southeast (so we would say that we have a "southeast" wind, or "winds are southeasterly"). More precisely, we could say that winds were 150 degrees (you may want to refer to the image of standard compass angles to confirm).
Wind Speed: Wind speed is simply how fast the air is moving. You may hear references to "sustained" wind speeds, which are wind speeds averaged over a certain time period (usually 1 or 2 minutes), but the wind is sometimes unsteady, with brief, sudden increases in wind speed called gusts. As a general rule, gusts last less than 20 seconds. Weather observers typically only report gusts when the wind varies by greater than 10 knots (between the peaks and lulls). However, reported wind gusts usually do not appear on station models.
In the United States, we usually talk about wind speed in miles per hour (just like automobile speed limits), but on station models, wind speed is always expressed in units of knots (nautical miles per hour). For the record, 1 knot = 1.15 miles per hour. On station models, the speed of the wind is expressed as a series of notches, called "wind barbs" on the clockwise side of the line representing wind direction. Each longer wind barb counts as a tally of 10 knots (actually, each longer barb represents a speed of 8 to 12 knots, but weather forecasters operationally choose the middle value of 10 knots for simplicity). The shorter barbs count as a tally of five knots. So, to figure out the wind speed, you need to add the values associated with any long and short wind barbs present.
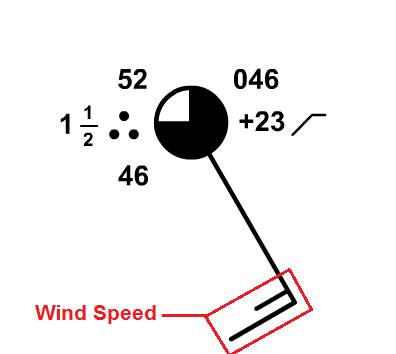
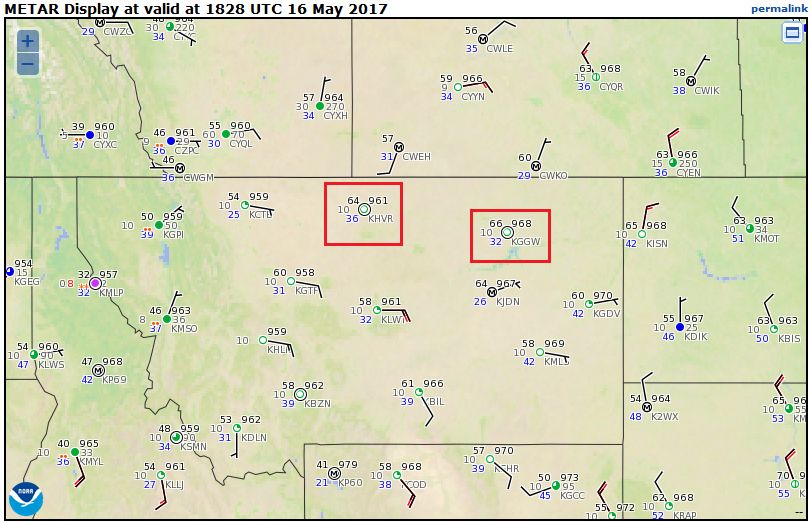
In the sample station model on the right, there's one long barb (10 knots) and one short barb (5 knots), so we add 10 knots and 5 knots together to get our wind speed of 15 knots (which converts to 17 miles per hour). If the surface wind is "calm," then it has neither direction nor speed. In this case, a larger circle is drawn around the circle that represents sky coverage. To see an example, check out the 1828Z map of station models over a portion of the western United States on May 16, 2017. The two stations I've highlighted (Havre and Glasgow, Montana) were both reporting calm winds.
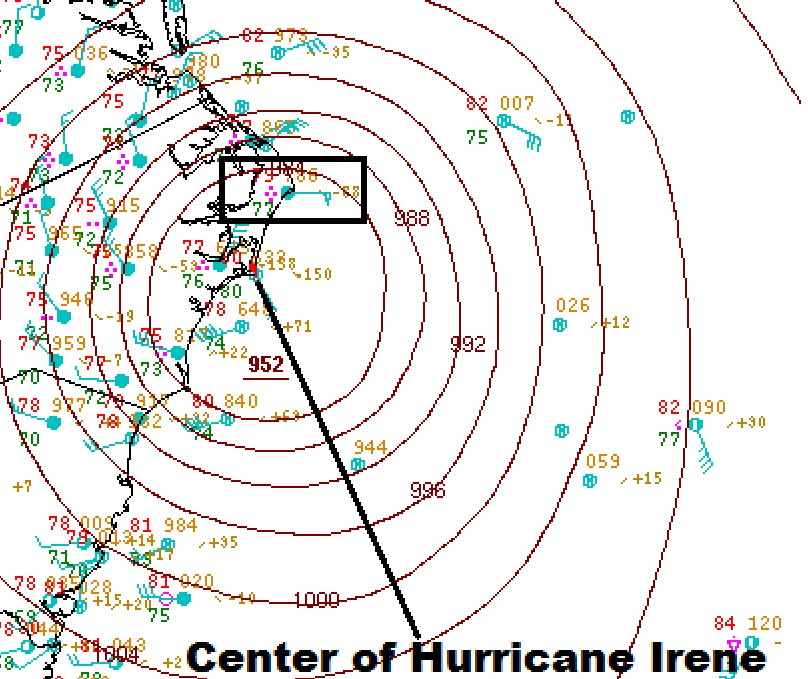
On the other hand, for very strong winds, a "triangular" barb counts as a tally of 50 knots.The use of the 50 knot symbol doesn't happen at the surface very often in most locations, however, because sustained winds rarely reach such speeds. Of course, wind gusts of 50 knots occur a little more frequently (severe thunderstorms, strong cold fronts, etc.). You're more likely to observe a sustained 50-knot wind near the Atlantic and Gulf Coasts with a hurricane nearby, such as the sustained 50-knot wind at Cape Hatteras, North Carolina, early on August 27, 2011 as Hurricane Irene approached.
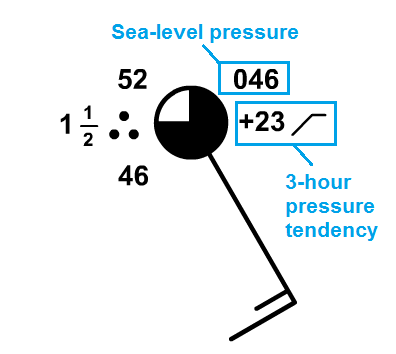
Finally, I should quickly note that I haven't covered a couple of parts of the station model dealing with air pressure. The remaining information to the right of the sky coverage circle represents sea-level pressure in millibars (upper right) and sea-level pressure tendency (the change over the past three hours). Sea-level pressure is the air pressure (the force per unit area exerted by air molecules) that would be exerted at sea level. We'll talk much more about the relevance of air pressure later in the course, and cover how to decode the pressure information from a station model, too. So, for now, don't worry about the pressure information on the station model.
Before you move on, be sure to spend some time on the Key Skill and Quiz Yourself sections below. They'll help you become familiar with interpreting sky coverage and wind direction / speed on a station model. Make sure you're comfortable with interpreting these variables on a station model before you move on!
Key Skill...
On this page, you learned about sky coverage, wind direction, and wind speed on the station model. The interactive station model below allows you to change these variables and see how the station model will look. I especially recommend entering various sky coverages, wind directions, and speeds (all the way from calm to speeds greater than 50 knots) in the "Current Conditions" panel.
I've also created a short video (3:20) that walks through a translation of all the variables we've covered so far in the station model, with an emphasis on wind direction and speed. Check it out!
You should be able to interpret most of the information from a station model, and our interactive station model tool will help you learn how to do that. I'm going to decode the parts of the station model that we've talked about so far, and explore wind direction and speed a bit more since they tend to be a bit more challenging.
For starters, at this station, the current temperature is 32 degrees Fahrneheit (temperature is the number in the upper-left of the station model). The dew point is in the lower left, so the dew point here is 30 degrees Fahrenheit.
The visibility is over on the far left here, and it's 2 miles in this case, because of light snow, as indicated by the 2 little snowflake icons. The sky is completely overcast, as indicated by the fact that this circle is completely filled in.
Of course, this tool is completely interactive, so we can change the weather conditions. We can change the temperature, the dew point, the visibility, and the present weather. So, now our temperature is 85 degrees Fahrenheit, our dew point is 70 degrees Fahrenheit, and our visibility is a half mile in a thunderstorm, and we can see the changes on the station model.
I want to spend a little time specifically on wind direction and speed so that you get used to the conventions for those variables. First, the tool defaults to a wind from 180 degrees. It's important to remember in meteorology that wind is expressed as the direction that the wind is blowing from.
If we assume that north is at the top of the image, south is at the bottom, west is on the left, and east is on the right, we can see that this 180-degree wind is blowing from the south to the north. We would call this a south wind, or a southerly wind.
We can change the wind direction to, say, 50 degrees. Now we have winds from the northeast to the southwest, and that's what it would look like on the station model. We would call this a northeast wind, or a northeasterly wind.
We can also tell wind speed from the station model. The speed here is 25 knots, as indicated by the two long wind barbs and the one short wind barb. Each long wind barb represents 10 knots, and the short wind barb represents 5 knots. So we sum those together, and we get a total of 25 knots.
If we had calm winds, we would just have an extra circle around the sky coverage because the wind doesn't have a direction. Or, on the other hand, we could make it really windy, and have 65-knot sustained winds –say maybe a hurricane is making landfall nearby. The pennant, or triangular barb, represents 50 knots, the long barb represents 10 knots, and the short barb represents 5 knots. Add those together, 50 + 10 + 5, to get our total of 65 knots.
I really encourage you to explore this tool. Trying out different conditions and seeing how the station model looks will help you get a feel for how to decode the station model.
Quiz Yourself...
Think you have a good handle on wind speed and direction on a station model? Take this self-quiz below to see how you do. Begin by hitting the "Quiz me" button. Fill in the missing wind direction and speed, and then hit "Submit" to check your answer. Wind direction can be rounded to the nearest 10 degrees and wind speed is to the nearest 5 knots. You may also turn on some directional hint lines if you have trouble estimating angles. If you've mastered wind direction and speed on the station model, you should be able to get the right answer just about every time!