Prioritize...
When you've finished this page, you should be able to discuss what isopleths are, and you should be able to apply the idea of isoplething to an elevation contour map (a topographic map).
Read...
Now that we've covered some basics about maps, let's start investigating some ways that meteorologists use maps! To begin with, if you are an avid hiker or skier, you've probably consulted a topographical map for insights into elevation and the "grade" (steepness) of slopes and hiking trails. Believe it or not, deciphering topographical maps actually lends itself to the process of interpreting weather maps.
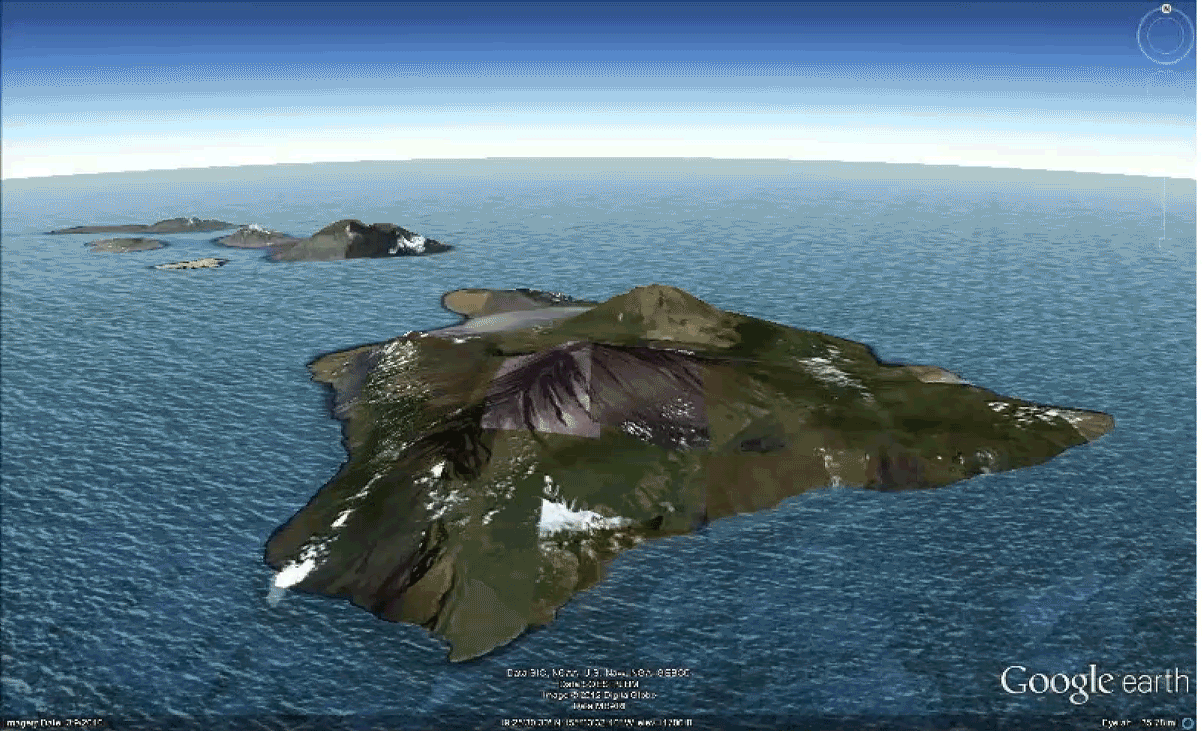
To get you started, let's look at the Big Island of Hawaii. Just in case you're not familiar with the topography of Hawaii, let's take a virtual fly-by of the Big Island to get a sense of the dramatically changing elevation on the Big Island. As you might have guessed, elevation changes rapidly, varying from sea level to the volcanic summits of Mauna Loa and Mauna Kea at 13,452 feet and 13,796 feet (respectively) in a relatively short distance.
Now that you have a sense for the wildly varying elevations on Hawaii, focus your attention on a topographical map of the Big Island (below). Such a two-dimensional map represents a "plan" or "top-down" view."
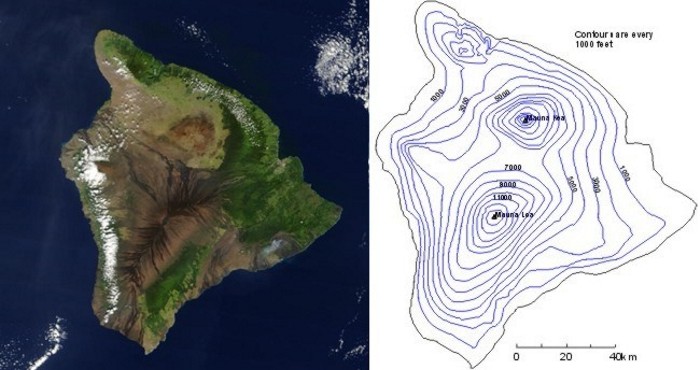
Each contour on the map is an isopleth, which is a contour connecting points of equal value ("iso" translates to "equal" and "pleth" means "value"). In this case, the isopleths connect points of equal elevation above sea level, and are drawn for every 1,000 feet of elevation above sea level. I point out, however, that such a choice is strictly arbitrary. Isopleths could have been drawn for every 250 feet above sea level, meaning that there would be four times the number of isopleths on the map, probably making it look a little cluttered. The arbitrary choice of 1000 feet for the "contour interval" was a trade-off between the look of the map and its detail.
To explain what I mean by "detail," consider the southernmost tip of the island. Suppose I asked you to locate the point precisely due north of the southernmost tip that has an elevation of 400 feet. With isopleths drawn every 1000 feet, you must visually estimate the distance from the southernmost tip to the 1000-foot contour and then pick a reasonable intermediate spot to place the point. Had contours been drawn every 250 feet instead of every 1,000 feet (the cluttered look), your task would have been a little easier and your answer would likely have been more accurate. Just in case you're having difficulty making the connection between a three-dimensional mountain and a two-dimensional topographical map, I've created a short video (2:00) showing a virtual representation of Hawaii's topography (video transcript) to help you to better visualize what I'm talking about.
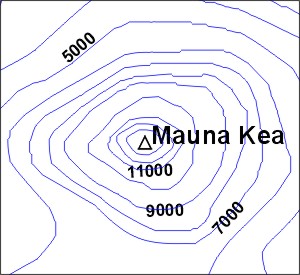
Looking at this virtual representation of Hawaii in the video, you might get the mistaken notion that all isopleths are closed curves or circles. Depending on the breadth of the map, however, some contours could conceivably extend from one side of the map to another without making a closed loop. Indeed, zooming in on the topographical map of the Big Island and restricting the focus just to Mauna Kea (see image on the right), some elevation contours now simply end at a boundary. We'll see this quite often when we start looking at contoured maps of weather variables.
The great thing about contour maps like our elevation map of Hawaii is that it allows us to see the elevation pattern relatively easily (much more easily than if we just plotted individual elevation numbers at random points). And, that's why meteorologists use contour maps regularly: contour maps help meteorologists easily find patterns in weather data. But, meteorologists must also be able to look at a contour map and, using the pattern of contours, estimate a value at any point. That's our next task at hand. Read on.