Prioritize...
After completing this page, you should be able to identify / discuss map features such as latitude lines, longitude lines (meridians) and projections. You should also be able to orient yourself on certain map projections (specifically polar stereographic and mercator projections).
Read...
Meteorologists are always looking at maps! But, anyone who uses maps regularly can tell you that all maps are not created equal. For starters, (most) maps are flat, and while that's very convenient (far more convenient than carrying around a globe to simulate the spherical Earth), there's a trade-off for using flat maps. To see what I mean, think about unraveling the skin of an orange in one piece and then trying to make it lie flat without breaking or distorting it. Good luck! Trying to create a flat map of our spherical Earth brings the same problems: No matter how you do it, you'll always have distortions.
A number of imperfect techniques (called map projections) exist for making flat maps of Earth. Each projection has its own strengths and weaknesses, and it's important for you to know what those are in order to analzye weather maps that you see. We're going to focus on two common projections here: polar stereographic projections and mercator projections.
Polar Stereographic Projections
On a polar stereographic projection, the observer's perspective comes from looking down at either the north or south pole. This unique vantage point allows operational weather forecasters to watch, for example, the movements of weather system over long distances. But, there's a catch (of course). Latitude lines, which run west-east (paralleling the equator) and mark the distance from the equator (0 degrees latitude), are not straight on polar stereographic projections. Instead, latitude lines appear as large circles (or arcs, if you're not looking at the entire hemisphere). Meanwhile, longitude lines (also called "meridians"), which run north-south and mark the distance from the Prime Meridian (0 degrees longitude), are straight, and they all converge at the poles. To see what I mean, check out the polar stereographic projection below.
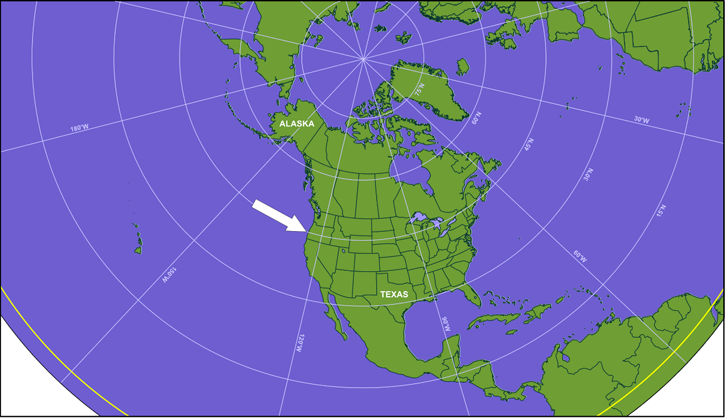
So, on polar stereographic projections, finding east and west isn't simply a matter of looking to the right or the left. Similarly, finding north and south isn't as easy as looking up or down on the image. Those directions will change orientation on the map depending on what area of the map you're looking at. For example, the arrow off the West Coast of the United States in the image above might look like it's blowing from the northwest, but if you look closely, it's blowing parallel to the nearest latitude arc. That means the wind is actually blowing from due west (270 degrees).
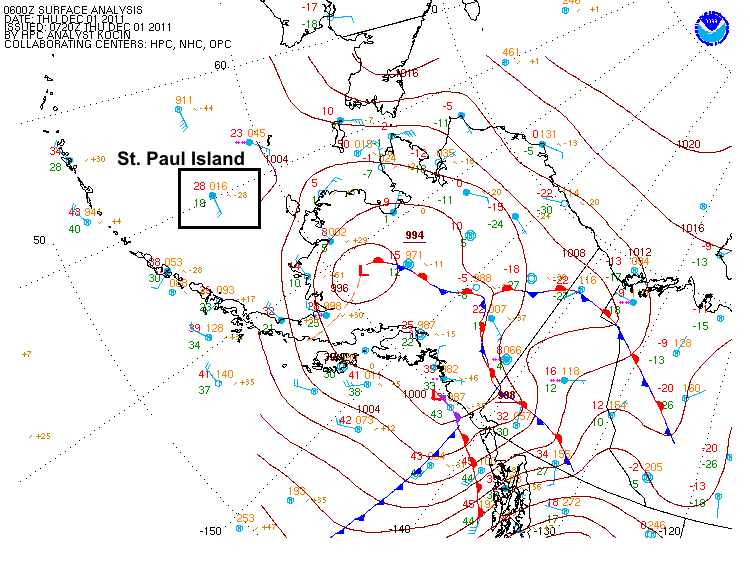
For a real-life example, take a look at this map including station models near Alaska from 06Z on December 1, 2011. I've outlined the weather station on tiny St. Paul's Island. Knowing that this is a polar stereographic projection, can you determine the wind direction? It might look like it's from the southeast at first, but it's really from due east (90 degrees). If you look carefully, the wind is blowing parallel to the nearest latitude arc. The bottom line is simply that you must orient yourself to the local latitude arcs and longitude lines on polar stereographic projections. Latitude arcs run west-east and longitude lines run north-south (and they intersect at right angles). Without orienting yourself, you can't properly determine things like wind direction. To further illustrate this issue, I created a short video below (2:37) that shows how the same wind direction can appear very differently on station models in different areas of a polar stereographic maps.
To help you get a feel for determining wind direction on polar stereographic maps, I'm going to use this interactive tool that shows a station model, and allows you to change its location as well as wind direction.
First, let's get our bearings -- this is a polar stereographic projection focused on the North Pole. Here's North America. Over here is Asia. Here's Europe, and Africa is toward the bottom.
Right now I have my station model located over Europe and it's set up for a 270 degree wind. That's a westerly wind. See how the wind flag parallels the local latitude circle at the station model?
If we keep our wind direction the same, but move our station model over North America, now it looks completely different. But, we know the wind is still westerly here because it's paralleling the local latitude circle at the station model.
Let's move it over Asia. Again, it looks completely different, but it's still showing a westerly wind because it still parallels the local latitude circle.
Now let's change wind direction to 180 degrees. The wind is blowing from south to north, and we know that because the station model is paralleling the local longitude line blowing from the south toward the North Pole.
But, if we move the station model over Greenland, like this, the southerly wind looks just like this. Again, the key is realizing that it parallels the local longitude line.
Now let's move our station model over Europe, and change our wind direction to 320 degrees. That's a northwesterly wind, so it won't parallel either a latitude circle or a longitude line.
But, this wind is clearly blowing from the northwest because it's coming from the north of the local latitude circle, and from the west of the nearest longitude line.
If we move the station model to the middle of North America, it now looks completely different, but the wind is still from the northwest, and we can tell that if we look at how the wind flag is oriented compared to the nearest latitude circle, which runs east / west, and longitude line, which runs north / south.
That's always the key when interpreting wind direction on a polar stereographic map.
There's one other big issue with polar stereographic maps--size and distance distortion. Note in the idealized polar stereographic map shown above that Alaska and Texas look to be about the same size. But, in reality, Alaska is more than twice the size of Texas! In fact, the farther you get away from the pole on a stereographic projection, the more signifcant the size and distance distortion, and that causes some issues when analyzing weather features closer to the equator. For analyzing weather features closer to the equator, meteorologists often turn to mercator projections.
Mercator Projections
Mercator projections are routinely used for weather maps and other imagery that focus on low latitudes (near the equator). This type of projection minimizes distortion near the equator, which makes it better for tracking weather systems at low latitudes. The closer you are to the equator on a mercator projection, the more accurate the distance representation.
Another benefit of the mercator projection is that compass directions are preserved. That's a huge benefit when tracking weather features over some distance. For example, north is always oriented in the same direction when looking at the image, regardless of where you are on the map. So, typically, north, south, east, and west are easy to find on mercator projections. You should still find latitude and longitude lines to orient yourself, but because each is a straight line, the directions are more intuitive, as shown in the sample mercator map below. North is at the top of the image, south is at the bottom, west is on the left, and east is on the right (regardless of location on the image).
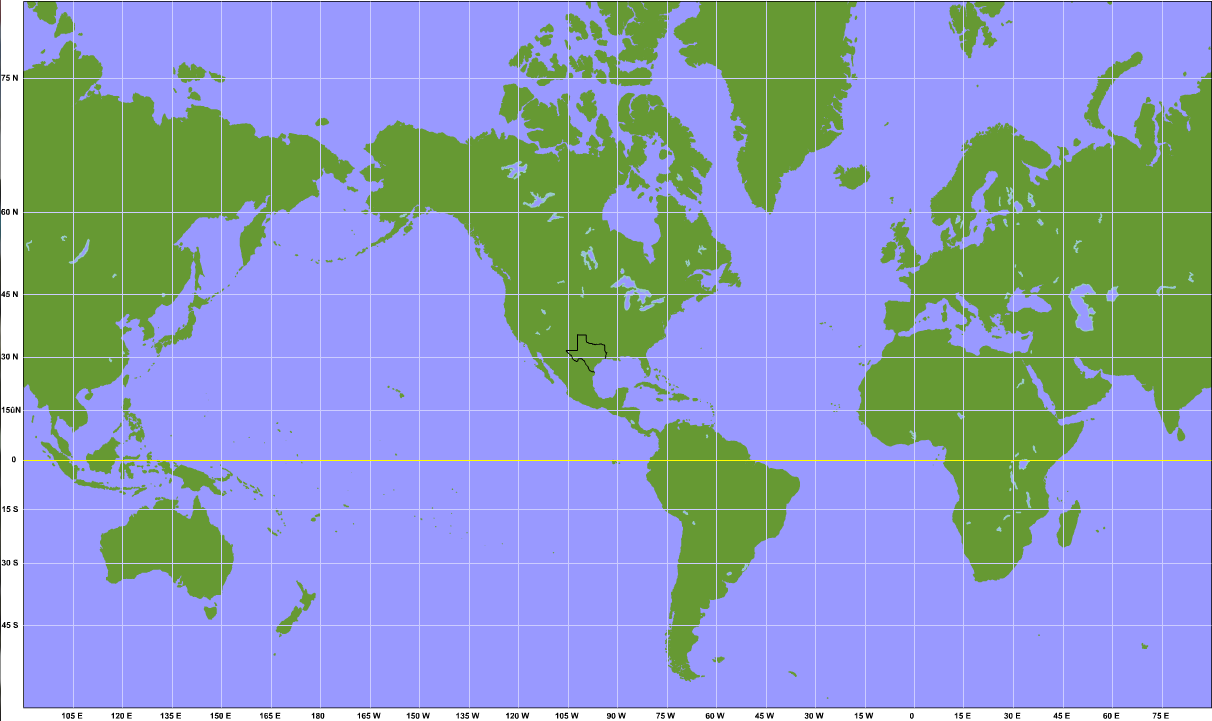
Since compass directions are preserved and distances at low latitudes are depicted with reasonable accuracy, why don't meteorologists just use mercator projections all the time? Well, size and distance distortion are significant farther away from the equator. As weather systems move north or south, that can be a problem because they might appear to change size, when in reality the changes are just an artifact of the map projection. On the mercator map above, for example, Alaska absolutely dwarfs Texas (far more than in reality). At even higher latitudes, Greenland looks to be about the size of Africa, but in reality, Africa is more than 13 times larger than Greenland. At the extreme, the North and South Poles (single points, in reality) appear as straight lines at the top and bottom of Mercator maps. Now that's distortion!
Ultimately, no map projection is perfect, and meteorologists use the strengths of each type to their advantage. But, they must be familiar with the quirks of each type of projection, or else they could easily draw an incorrect conclusion about the direction, distance moved, or the size of a weather feature. Most often, it seems that students are a bit less familiar with polar stereographic projections, so to help you get comfortable with working them, check out the Key Skill and Quiz Yourself boxes below so that you can further explore the interpretation of these maps, and practice with determining wind direction on them.
Key Skill...
Determining wind direction on polar-stereographic plots can be a challenge, so to help you get the hang of it, check out the interactive tool below that allows you to enter a wind direction (in degrees) and then move the tool's station model across a polar stereographic map. By moving the station model over the polar stereographic map, you can see how the look of the wind flag on the station model changes relative to local latitude and longitude lines. You can also pick a location for the station model, and input different wind directions to see what the wind flag looks like.
Quiz Yourself...
If you think that you have a handle on reading wind direction on a polar stereographic map, give this quiz a try. Start by clicking "Quiz Me." Look at the station model on the polar stereographic map and enter the wind direction on the right. Don't forget to round answers to the nearest 45 degrees, and hit submit to see how you did. If you really understand the concept, you should be able to get it right every time! If you find that you need more practice, you might want to revisit the "Key Skill..." section.