Prioritize...
At the end of this section, you should be able to discuss the change of atmospheric pressure with increasing height, the difference between "station pressure" and "sea-level pressure," analyze maps of isobars (contoured maps of pressure), and decode pressure from a station model.
Read...
In the last section, our discussion of pressure was focused on the pressure at sea level. But, most of the United States (and the rest of the world's land masses) aren't at sea level, so why make that distinction? Well, in order to analyze the horizontal patterns of surface air pressure that govern weather, meteorologists require a "level playing field," and that's why they're interested in "sea-level pressure."
To see what I mean, consider this: if you brought a barometer with you on a trip to Denver, Colorado (elevation about one mile above sea level), it would regularly measure a pressure of about 850 millibars. That's much lower than the typical range of sea-level pressures we talked about in the previous section. The pressure on your barometer would be so low because pressure decreases with increasing height everywhere in the atmosphere. The reason why that's the case is fairly intuitive: the higher the altitude, the less air (and weight) there is above you in an atmospheric column. In fact, pressure at the top of the troposphere is typically less than 300 millibars (less than 30 percent of the pressure at sea level).
So, the fact that pressure decreases with increasing height explains why the surface pressure at high elevation locations (like Denver) is much lower than at sea level. For meteorologists, surface pressure's dependence on elevation presents a bit of a problem. To see what I mean, check out the map of long-term average surface pressure (called station pressure) across the United States below.
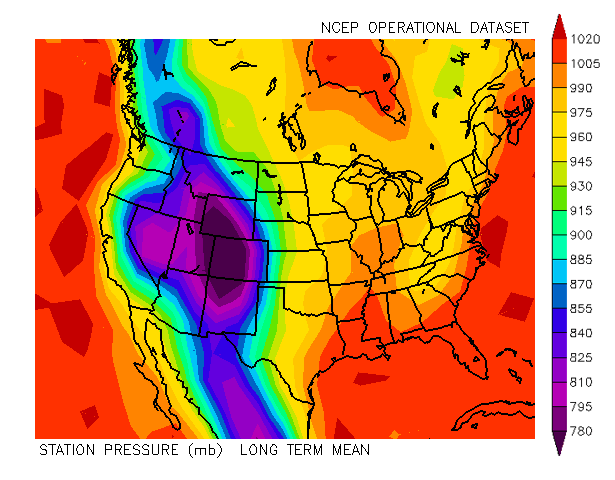
The first thing you might notice on the map is the area of very low pressures in the Rocky Mountains (less than 780 millibars in some areas). Is there some kind of monster low-pressure system permanently parked in the Rockies? Of course not! The station pressures are always low there because of the high elevations in the Rockies. The dramatic variation in station pressure based on elevation makes it virtually impossible for meteorologists to use station pressure to track centers of high and low pressure. Regardless of the strength and position of various high- and low-pressure systems, the map of station pressure would always look something like the one above (lowest pressures in the highest-elevation regions). So, in order to level the playing field, meteorologists adjust station pressure to sea level.
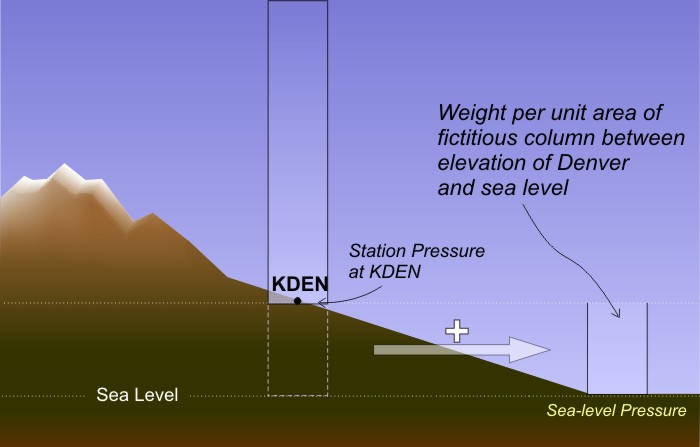
By adjusting to sea level, meteorologists are essentially pretending that high-elevation locations (like Denver) are located at sea level, and as such, they adjust all barometer readings to what they would be if they were located at sea level. To do so, meteorologists "correct" the station pressure to sea level by estimating the weight of an imaginary column of air that extends from station to sea level. I'm skipping the details, but the bottom line is that this estimated weight of the imaginary air column gets converted into a pressure adjustment that is added to the observed station pressure (this schematic may help you visualize the adjustment process). While the estimating process isn't perfect (especially for very high elevation locations), the end result is a sea-level pressure value that can be used to plot useful weather maps, which help meteorologists track high- and low-pressure systems more effectively.
Thus, the contour maps of pressure that meteorologists most commonly work with (and that we'll most commonly work with) are maps of sea-level isobars (remember that "isobar" is the name of a contour of equal pressure). Maps of sea-level isobars help weather forecasters quickly spot areas of low and high pressure, which can help them identify areas of potentially stormy weather. For example, check out the analysis of sea-level pressure from 12Z on October 30, 2017 below, and note the strong low-pressure system centered just north of New York state (marked by the "L") in the Canadian Province of Quebec).
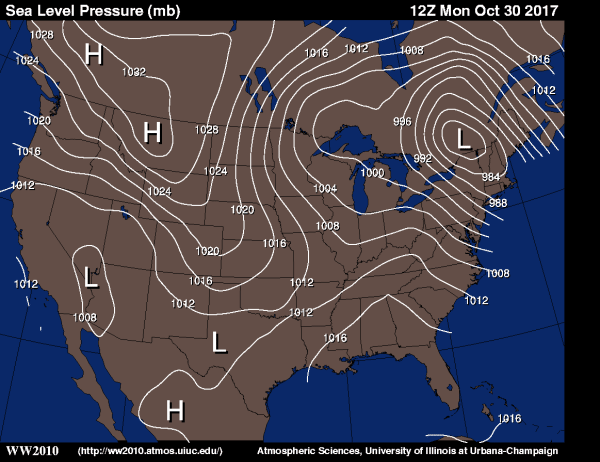
If you remember how to interpret contour maps, you should be able to estimate the pressure at the center of this strong low. The contour interval on this map is four millibars and the innermost labeled closed isobar around the low is 984 millibars. There's one unlabeled closed isobar inside the 984-millibar isobar, which represents 980 millibars. The center of the low is located inside that isobar, so its lowest pressure must have been less than 980 millibars, but greater than 976 millibars (otherwise there would have been a 976-millibar isobar drawn).
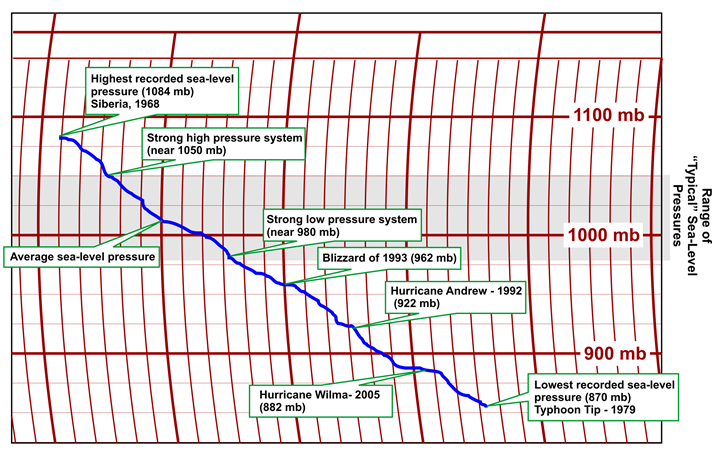
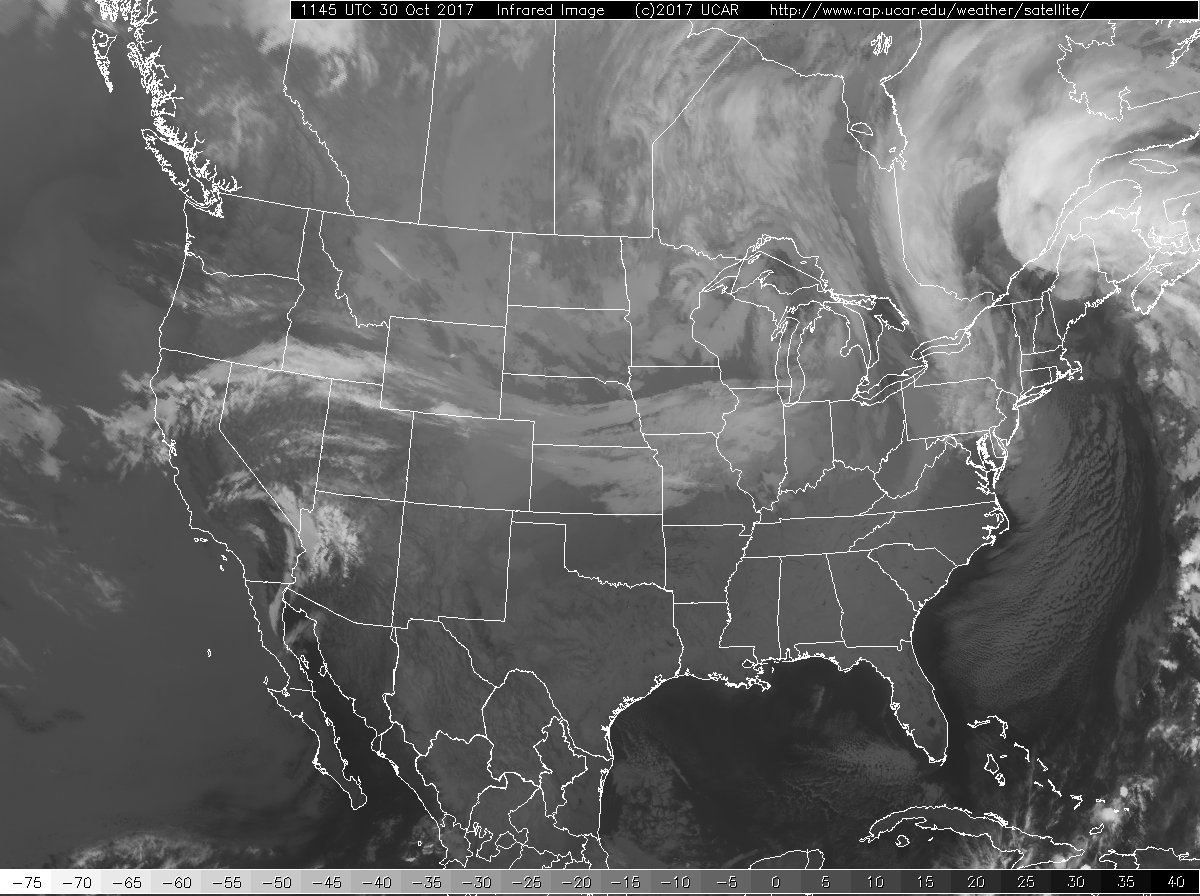
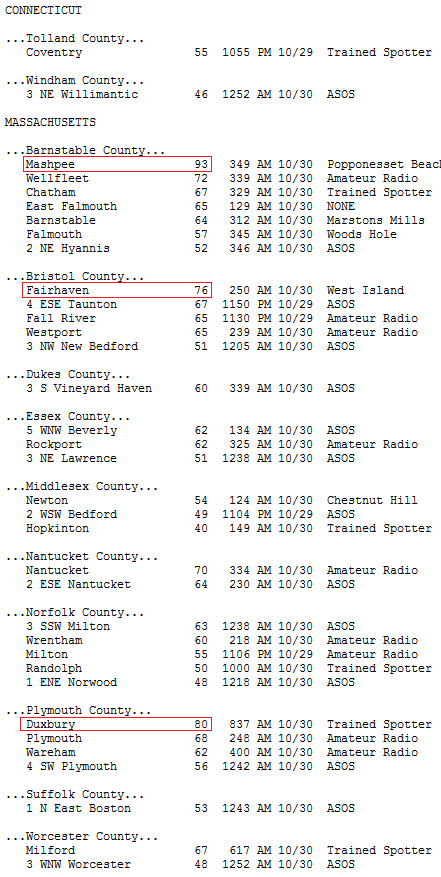
To place this sea-level pressure in perspective, check out the barograph showing the range of sea-level pressures again. A sea-level pressure less than 980 millibars represents a pretty strong low, so we might expect some pretty "active" (stormy) weather in the Northeast U.S. around the low-pressure system depicted above. Indeed, that was the case! Check out the 1145Z infrared satellite image from October 30, and note the fairly bright white shading in the region, indicative of an organized area of cold cloud tops. This storm brought drenching rains to the Northeast, along with damaging wind gusts (the National Weather Service office in Boston compiled this list of strongest wind gusts, including several reports of gusts greater than 75 miles per hour). More than a million people lost power in New England from this storm.
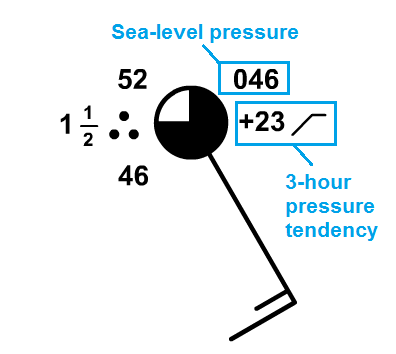
So, where do the pressure observations come from that are used to make maps of sea-level isobars like the one above? Station pressure is routinely measured at surface weather stations (along with temperature, dew point, wind, etc.) and is reported in the station model after being adjusted to sea level. Back when we first covered the station model, we didn't discuss the pressure information that it contains (highlighted in the image on the right), but now it's time. In particular, we're going to focus on the three digits in the upper-right corner (the pressure tendency information is not always reported, so we're going to ignore it in this course). The three digits in the upper-right-hand corner of the station model represent the last three digits of the station's sea-level pressure, expressed to the nearest tenth of a millibar. Thus, to decode the pressure reading, you must first add a decimal in front of the right-most digit. Then you need to place either a "9" or a "10" in front of the three digits.
How do you decide whether a "9" or a "10" should go in front of the three digits? This is where knowing the typical range of sea-level pressures is helpful. Remember that nearly all values of sea-level pressure are between 950 millibars and 1050 millibars (unless you're dealing with an intense hurricane, or an extremely strong Arctic high in winter). So, in the example on the right, we must need a "10" in front of the "046" to give 1004.6 millibars. Placing a "9" in front would have given 904.6 millibars, which wouldn't make sense (unless an extremely intense hurricane was right near the station).
Ultimately, if the three digits you see on the station model are less than "500," you'll typically place a "10" in front of them, while if the three digits are greater than "500," you'll typically place a "9" in front of them. In most cases, you want to choose whichever will give you a sea-level pressure between 950 mb and 1050 mb. Some exceptions to this rule exist (intense hurricane or very strong Arctic highs in the winter), but in the scheme of things, the exceptions are rare. To get some practice with decoding sea-level pressure from station models, check out the Key Skill and Quiz Yourself sections below. After you've finished with those, up next we'll start to examine the forces that control the wind so that we can use patterns of isobars to diagnose how the wind will blow.
Key Skill...
A key skill in this section is decoding pressure on a station model. Experiment with the station model tool and observe how different pressures are coded. For example, type in pressures of 999.6 mb, 986.2 mb, and 1028.9 mb and see how they appear on the station model. Practice decoding some random 3-digit coded pressures (decode "953", "069", and "395", for example) and check your answers with the tool by typing your answer into the "Current Conditions" panel and see if the station model displays the 3-digit code that you started with.
Think you have a good handle on decoding pressure from a station model now? Here are a few more examples for you to try. If you don't get these right on the first try, you may need to spend more time exploring with the interactive station model...
Example #1:
You see a station model with "957" in the upper-right corner. What is the sea-level pressure at this station?
Answer: 995.7 millibars. We arrive at this conclusion by placing a 9 in front. If we had put a 10 in front, we'd have had 1095.7 millibars, which would be much higher than any sea-level pressure ever measured on Earth.
Example #2:
You see a station model with "234" in the upper-right corner. What is the sea-level pressure at this station?
Answer: 1023.4 millibars (most likely). We arrived at this conclusion by placing a 10 in front. If we had put a 9 in front, we'd have 923.4 millibars, which is really only possible in a hurricane.
Example #3:
You see a station model with "701" in the upper-right corner. What is the sea-level pressure at this station?
Answer: 970.1 millibars (most likely). We arrived at this conclusion by placing a 9 in front. If we had put a 10 in front, we'd have 1070.1 millibars, which would be near the highest sea-level pressure ever recorded on Earth (an extremely rare situation).