Prioritize...
At the completion of this section you should be able to define the terms "ridge" and "trough" as they pertain to surface pressure. You should also be able to discuss the patterns of surface convergence and divergence, as well as the vertical motion and typical weather associated with surface troughs and ridges.
Read...
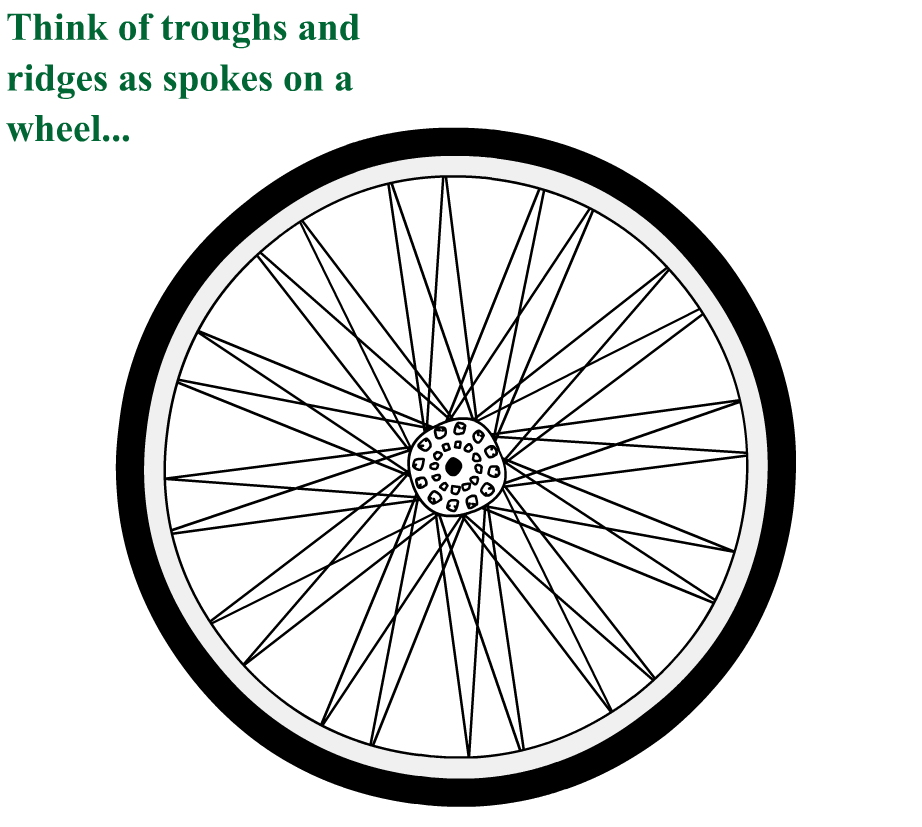
Like spokes on a bicycle wheel, there are "spokes" that extend outward from the hubs (centers) of low and high pressure systems, called "troughs" and "ridges." On the idealized surface weather map on the left below, the bulgings of the isobars south, north, east and west of the center of the low-pressure system are called troughs, which are simply elongated areas of low pressure. Instead of closed, oval-shaped isobars encircling a discrete center of low pressure, the isobars that form a trough are "open," with their cusps aligned to form a trough axis (the dashed lines running through the cusps in the isobars mark four distinct trough axes in the image below on the left).
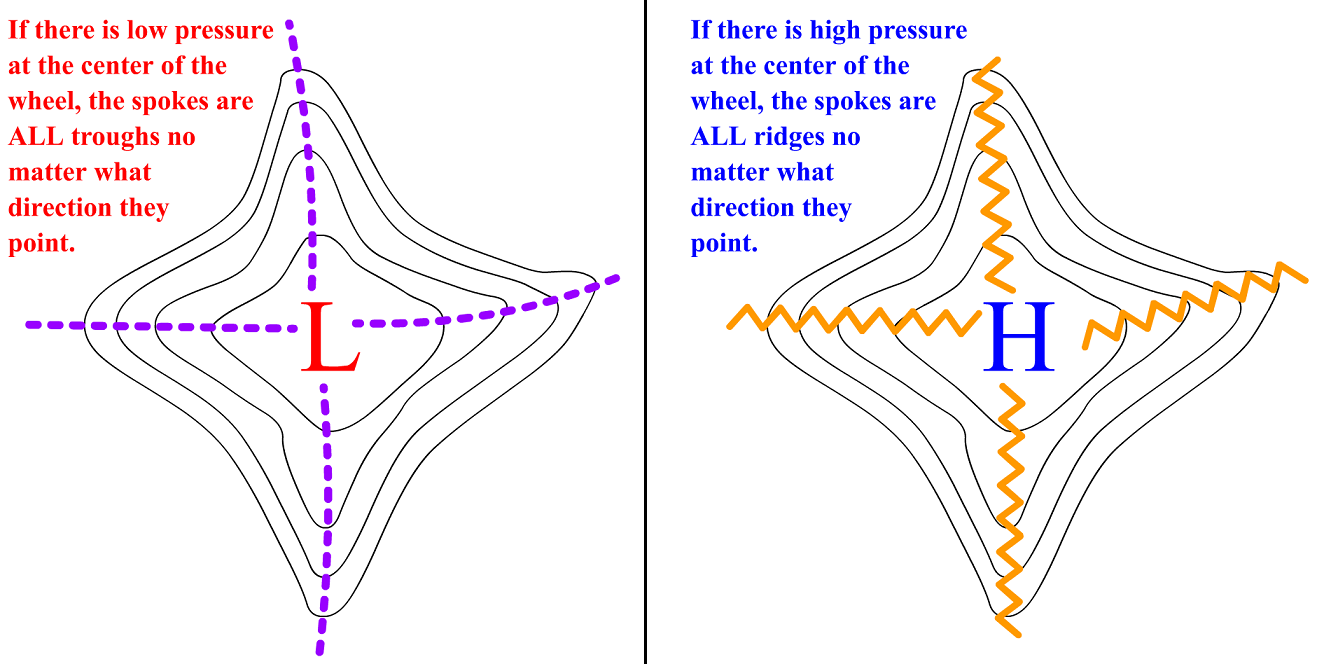
On the flip side of lows and troughs, spokes emanating from the center of a high-pressure system are called ridges of high pressure, which are simply elongated areas of high pressure. Instead of a few closed, oval-shaped isobars encircling a discrete center of highest pressure, the isobars that form a ridge are "open," with their cusps loosely aligned to form a ridge axis (the serrated lines running through the cusps in the isobars mark four distinct ridge axes in the image above on the right).
Troughs and ridges are key features to look for when examining a sea-level pressure map. Sometimes these features are easy to spot and identify, but other times identification can be tricky. Either way, you can always identify troughs and ridges by studying the pattern of isobars. For example, check out this idealized surface weather map, and focus on the low pressure system and its trough. Even if the center of low pressure wasn't labeled and the axis wasn't marked with a dashed line (the conventional symbol for a trough), we could identify southward bulge in the isobars as a trough by performing a simple check. Note that any two points A and B lying on opposite sides of the marked axis (at some small perpendicular distance) have pressures greater than the pressure of the corresponding point T on the axis. In this example, point T has a pressure of 1024 millibars, while points A and B likely have sea-level pressures of approximately 1026 millibars. Thus, the pressure at point T is a relative minimum. All points on the axis pass a similar test, so it's an elongated area of relatively low pressure, which by definition, is a trough.
Like the more compact closed-isobar centers of low pressure, troughs mark areas of convergence and rising air, making them potential breeding grounds for clouds and precipitation. To understand this claim, look at the wind direction following a single isobar (below) as it traverses the trough (all wind directions are consistent with previous discussions about the typical angles that surface winds cross isobars because of friction).
Note that, west of the trough axis extending south of the center of low pressure, winds blow from the west-northwest. East of the trough axis, winds blow from the south-southwest. It should be clear that trough axes always mark a shift in wind direction. Moreover, wind shifts at a trough axis are linked to convergence. As proof, picture the wind vectors as cars trying to round a sharp corner. In a trough, notice that each car is "cut off" by the car in front. Clearly, there is plenty of traffic congestion at the trough axis. In other words, there is convergence, and the air rises as a result.
In the real world, surface lows do not necessarily have four well-defined troughs that lie directly north, south, east and west of the low's center. Indeed, the number and orientation of well-defined surface troughs can vary from low to low. To see what I mean, check out this 15Z surface analysis from May 7, 2012. I've marked (with dashed orange lines) the troughs emanating from a pair of low-pressure centers. Just for the record, I removed the cold and warm fronts from the analysis just for clarity. It should be clear to you that surface troughs can extend in any direction (they certainly don't all sag southward).
In fact, when a trough extends northward, weather forecasters call it an "inverted trough." Sometimes, inverted troughs form north of developing low-pressure systems during the cold season. When they form over the Gulf States, inverted troughs have easy access to moist air overlying the Gulf of Mexico and are notorious for producing heavy precipitation as moist air converges and rises near the trough axis. In such cases, inverted troughs rank high on my list of big "weather makers."
Now let's turn our attention to ridges of high pressure. Remember that ridges are simply elongated areas of high pressure, and that's evident when you check out this idealized sea-level pressure map with a center of high pressure and associated ridge. As with our trough above, we can perform a simple check to identify this northward bulge in the isobars as a ridge, even if the "high" wasn't labeled and the axis wasn't marked with a serrated line (the conventional symbol for a ridge). Let's choose any two points C and D lying on either side of the axis at some small perpendicular distance. Note that the point R that lies exactly on the axis has a surface pressure of 1020 millibars while air pressures at points C and D (about 1018 millibars) are less than at point R. Thus, the pressure at point R is a relative maximum. All points on the axis pass a similar test, so the axis marks an elongated area of high pressure, which is a ridge, by definition.
Like the more compact closed-isobar centers of high pressure, ridges of high pressure produce surface divergence. If we again draw wind vectors along a single isobar that traverses a ridge axis (like in the image below), note how air spreads out or diverges as it traverses the ridge. In compensation for surface divergence, air sinks in the columns of air located over the ridge axis, typically resulting in dry, bright weather.
Like troughs, the number, and orientation of well-defined ridges around a high pressure system varies from high to high. Here's a realistic example of a high-pressure system and its associated ridges. Ultimately, weather forecasters are always on the lookout for surface troughs and ridges because of the implications for wind shifts, surface convergence and divergence, and rising or sinking air.
Summary
Surface troughs
- are elongated areas of low pressure
- are zones of surface convergence and rising air, often leading to clouds and precipitation
Surface ridges
- are elongated areas of high pressure
- are zones of surface divergence and sinking air, often leading to dry, fairly sunny weather
Troughs, in particular, are of great importance to weather forecasters because they also hold a connection to the air masses and fronts that we've studied previously. Read on to explore this connection!