Prioritize...
When you've finished this page, you should be able relate surface pressure to the weight of an air column above a point. You should also be able to express pressure with the proper units and discuss the typical range of sea-level pressure on Earth.
Read...
"Pressure...pushing down on me, pressing down on you..."
Those lyrics come from this section's theme song -- ”Under Pressure“ by Queen (featuring David Bowie) from 1981. As we start our investigations of pressure (and ultimately wind), we have to start with the basics. For starters, what is pressure? On that matter, Queen basically nailed it. It's a force that pushes down on me and you (and everything else). More formally, you may remember from a high school science class that pressure is defined as a force per unit area.
Meteorologists are concerned about atmospheric pressure -- the pressure exerted by air molecules. The pressure exerted by air molecules at a weather station is approximately the weight of the air in a column that extends from a fixed area on the ground to the top of the atmosphere. At sea level, the weight of a column of air on one square inch of area is roughly 14.7 pounds, resulting in an air pressure of 14.7 pounds per square inch. For perspective, that amounts to a total force of more than 2 tons on just the area covered by a single base on a baseball field (an 18-inch by 18-inch area). Surprised?
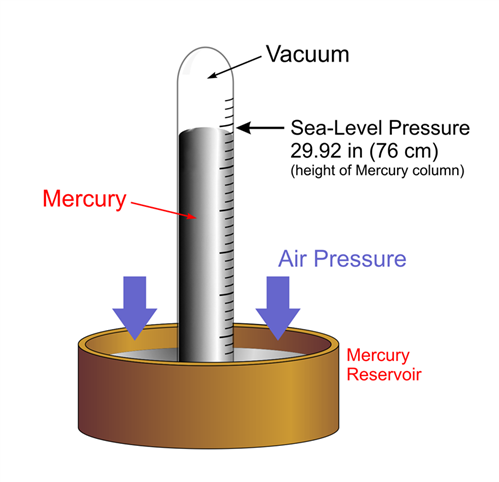
Meteorologists typically don't work with pressure in pounds per square inch, however. Most home barometers (instruments for measuring atmospheric pressure), for example, express pressure in inches of mercury, which is based on the mercury barometer. Mercury barometers measured pressure after air was evacuated from a glass tube, and the open end of the tube was immersed in a reservoir of mercury, allowing air pressure to force mercury to rise in the glass tube. At sea level, the standard height of the mercury column is 29.92 inches. More commonly, meteorologists often work with pressure in units of millibars (abbreviated "mb"). For reference, an atmospheric pressure of 14.7 pounds per square inch (when the height of a Mercury barometer would be 29.92 inches) is equal to about 1013 millibars.
The connection between surface pressure and the weight of a column of air that extends above the surface has many important consequences. For starters, processes that reduce the weight of an air column also act to decrease the surface pressure. On the other hand, processes that add weight to air columns act to increase surface pressure. Evolving horizontal patterns of air pressure are crucial to weather forecasting, which is one of the reasons why forecasters pay such close attention to centers of highest and lowest pressure on weather maps (typically marked by a blue "H" and a red "L", respectively). In a very general sense, low-pressure systems tend to bring inclement weather (clouds and precipitation), while high pressure systems tend to bring "fair" weather (sunshine and relatively calm conditions).
The bottom line here is that when you hear meteorologists refer to a "low pressure system," what they are really talking about is a "lightweight." In other words, the air column above the center of a low weighs less than any of the surrounding air columns. On the flip side, a high pressure system is a "heavyweight" because the air column above the center of the high weighs more than any of the surrounding air columns. Now, I should point out that the difference in pressure between a run-of-the mill high-pressure system and a pretty strong low-pressure system is only about five percent. In the image on the right, for example, the difference between the labeled high and low is only 32 millibars (1018 millibars - 986 millibars), so the difference was even less than five percent in this case. Still, these differences have very important consequences for the weather, as you'll learn!
To get a feel for the range of pressures at sea-level, check out the graph below. Remember that standard sea-level pressure is around 1013 millibars, while a very strong high pressure system in the winter may measure around 1050 millibars. On the other hand, a representative value for sea-level pressure at the center of a formidable low-pressure system that can cause, for example, heavy snow during winter might be in the neighborhood of 960 to 980 mb.
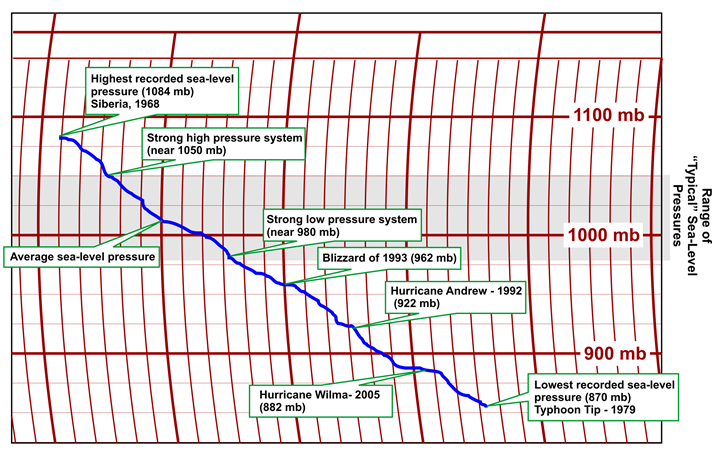
The bottom of the observed range of sea-level pressures is populated by the "kings" of all low-pressure systems on our planet -- hurricanes (called "typhoons" in some parts of the world). Very intense hurricanes can have sea-level pressures down near 900 millibars. In 2017, for example, at its peak intensity, Hurricane Maria had a minimum sea-level pressure of 908 millibars. The storm later went on to devastate Puerto Rico, and its fierce winds completely destroyed the island's NEXRAD Doppler radar (this short video highlights Maria's damage to Puerto Rico, and includes some stunning images of the damage to the radar, if you're interested). A handful of hurricanes and typhoons globally have even had sea-level pressures drop a bit below 900 millibars.
Ultimately, the pressures associated with very intense hurricanes and very strong high-pressure systems in the winter (more than 1050 millibars) are pretty rare. As a general guideline, nearly all sea-level pressures lie between 950 millibars and 1050 millibars, with most sea-level pressure readings falling between 980 millibars and 1040 millibars.
You'll want to keep this range in mind, because it will come in handy as we interpret pressure data from various maps. You also may have noticed that I was careful to specify "sea-level" pressure when discussing pressure values. Why is that? You'll find out in the next section as we explore contour maps of pressure (maps of "isobars"). Read on.