Prioritize...
At the completion of this section, you should be able to discuss why fronts are located in troughs and discuss trends in sea-level pressure associated with a frontal passage.
Read...
Now that you've learned about the circulations around high- and low-pressure systems, we're going to tie that new knowledge in with some topics that we covered previously in order to help you better see the big picture. For starters, let's review a couple of key definitions:
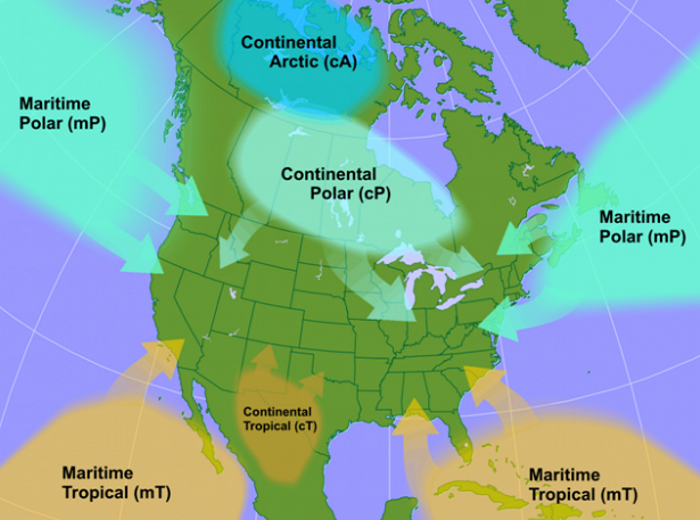
- Air Masses are large blobs of air with horizontal dimensions of several hundred to a couple of thousand miles, within which temperatures and moisture (dew points) at the surface (or at any other arbitrary altitude) are fairly uniform. In other words, temperature and moisture gradients within an air mass are small. Several types of air masses exist, and are named based on their source regions (which determine their temperature and moisture characteristics).
- Fronts are boundaries that separate contrasting air masses. Since fronts lie at the edges of contrasting air masses, not surprisingly, fronts lie in zones with large gradients in temperature and dew point. The types of fronts we discussed previously are cold fronts, warm fronts, and stationary fronts.
So how are air masses, fronts, and the pressure pattern related? For starters, recall how air masses get their characteristics. In order for a large chunk of air to acquire the temperature and moisture characteristics of the underlying surface of the earth, it must stay over a given source region long enough for land or water to modify the overlying air. For this process to occur, it stands to reason that surface winds must be generally light. Broad regions of light winds are often found surrounding centers of surface high pressure, thus high-pressure systems mark the centers of air masses.
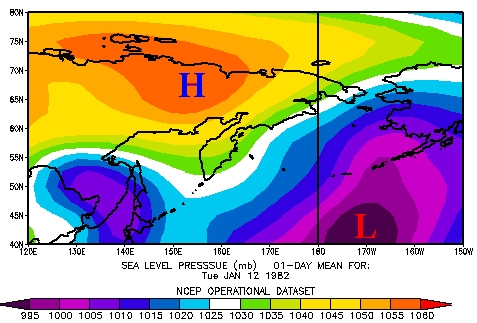
To see what I mean, check out the analysis of sea-level pressure from January 12, 1982. Note the strong high pressure system over Siberia, a region renowned as a source region for continental-Arctic (cA) air masses. Now, compare the pressure gradient around the high's center to the gradient around the low-pressure system centered over the Sea of Japan. Clearly, the pressure gradient associated with the high is much weaker than the pressure gradient around the center of low pressure, which translates to very light winds around the Siberian high. Those light winds allow the snow-covered, frigid ground to modify the overlying air and create a bone-chilling continental-Arctic (cA) air mass (the fact that northern Siberia, at latitudes above the Arctic Circle, tallies 24 hours of darkness each day during the heart of winter certainly helps).
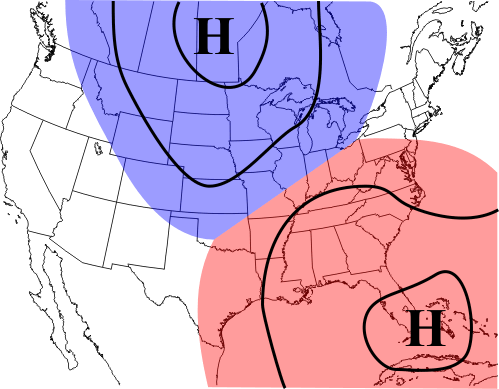
So, if the "meteorological center" of an air mass is marked by a center of high pressure, then pressure must naturally decrease as you move toward the periphery of the air mass. When two air masses meet, the boundary must be a region of lowest pressure (because as you cross the boundary, pressure will start to increase again toward the center of another high). I think the schematic on the right, showing two opposing air masses and their high-pressure systems, provides a helpful visual. Clearly, the transition zone between the two air masses must lie in a region of relatively low pressure.
Of course, the boundaries that separate contrasting air masses are called fronts, which leads us to the following conclusion: fronts lie in troughs of low pressure. Now, not all surface troughs coincide with fronts, but the bottom line is that fronts naturally exist in elongated regions of low pressure (troughs). Also recall that surface troughs are regions of wind shifts and surface convergence. Therefore, since fronts lie in troughs, then it also stands to reason that shifts in wind direction and surface convergence occur along fronts.
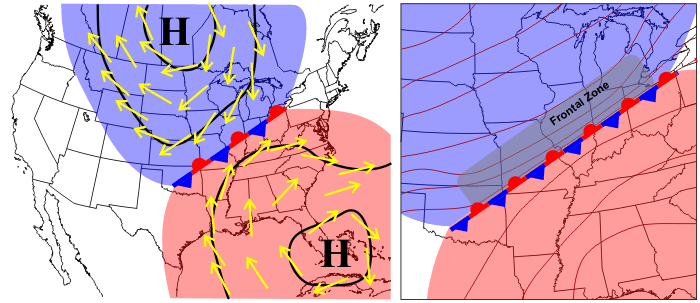
Wind shifts along fronts are also supported by the notion that a front is a boundary between opposing high pressure systems. Notice in the diagram below that the flow of air associated with the two high-pressure systems is divergent -- spreading outward away from a center of high pressure. Along the stationary front (alternating blue barbs pointing toward warmer air and red circles directed toward cold air) that marks the boundary between the air masses, winds from markedly different directions meet. Ultimately, the stationary front lies just on the warm side of the large temperature gradient associated with the frontal zone (right).
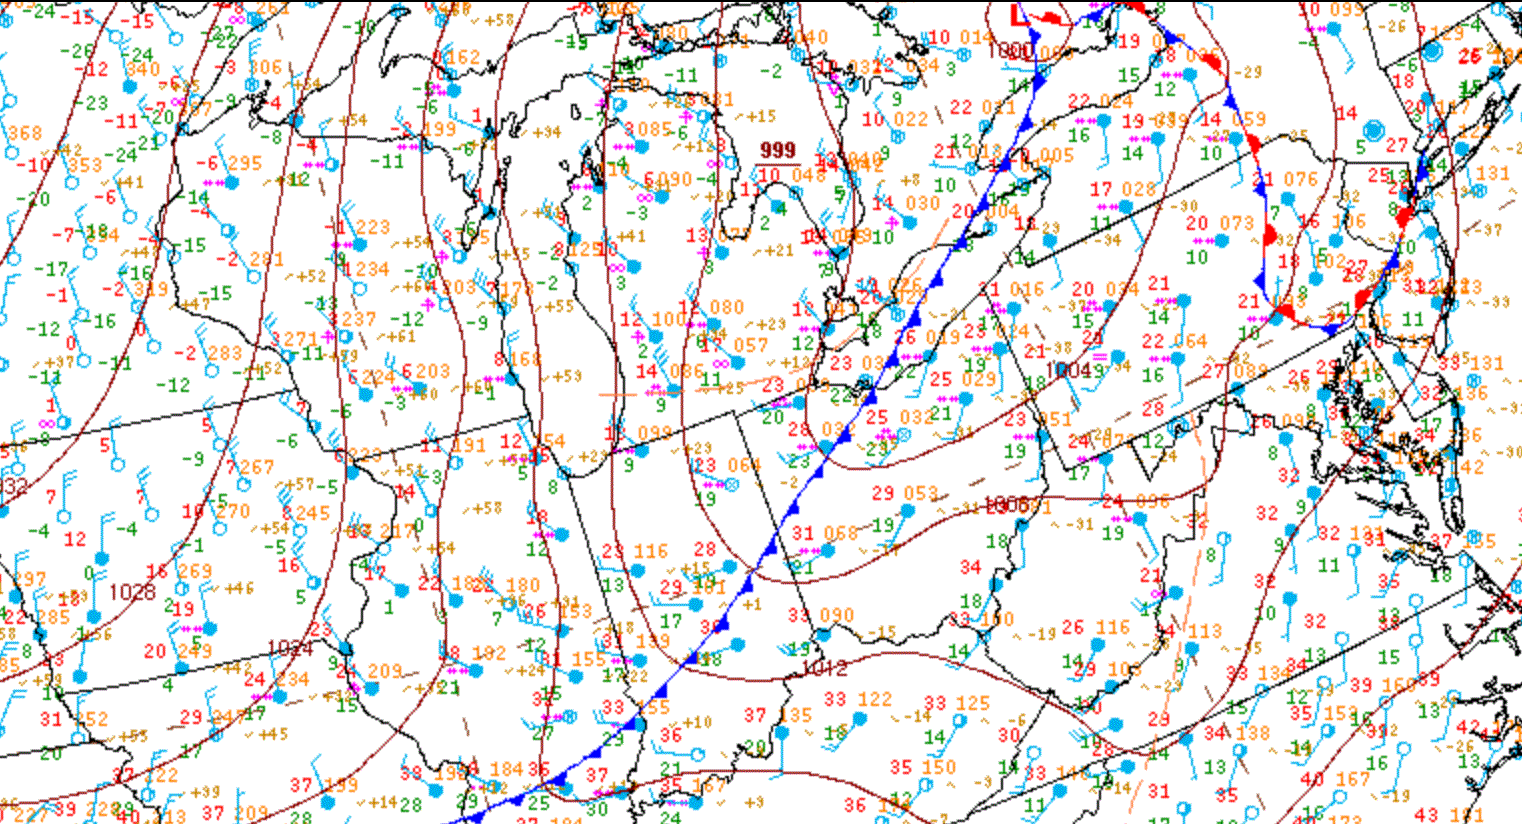
The shift in wind direction, surface convergence, and the fact that fronts lie in troughs all have consequences for the weather you may experience when a front passes. To see what I mean, let's turn to the morning of February 14, 2015, when a cold front was passing through northwestern Ohio. You can see the location of the front on the 15Z surface analysis, and note how the front lies essentially between different areas of high pressure (contrasting air masses) similar to our schematics above. If we zoom in on the analysis, it becomes more apparent that the cold front also lies in a southwestward bulge in the isobars, which marks a surface trough. Also note the dramatic wind shift across the front -- southwest winds ahead of the front in eastern Ohio, compared to north-northwest winds behind it in northwestern Ohio, Indiana, and Michigan.
When the front passed Findlay, Ohio around 15Z, the change in weather was notable, as you can tell from the graphs below. The top graph plots temperature, dew point, and relative humidity from 04Z on February 14, 2015 through 05Z on February 15. I've marked 15Z with a vertical black line. At 15Z, both temperature and dew point (purple and green traces, respectively) started to decline as colder, drier air arrived behind the cold front (so temperatures started dropping, even though it was 10 AM local time). Winds (as marked on the station models below the top graph) shifted from southwesterly and west-southwesterly ahead of the front to northwesterly after the front passed.
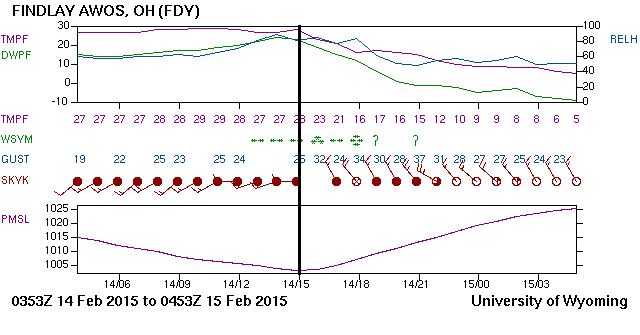
Finally, the bottom graph shows sea-level pressure, and pressure reached a minimum around the time the cold front passed at 15Z. That should make sense to you, since fronts lie in troughs. Pressures steadily decreased until the front (and its trough) arrived, then pressure began increasing after the front passed (and the trough moved away with it). You can also tell that the frontal passage came with some snow (note the station model symbols for snow beneath the top graph), thanks in part to surface convergence and rising air in the vicinity of the front.
So, understanding the circulation of air around highs and lows, and how the pressure pattern ties in with air masses and fronts allows us to understand a lot of weather events that we experience! But, I've just scratched the surface here. We're just getting started in discussing the various types of weather (clouds, rain, snow, thunderstorms, etc.) that we experience every day. Specifically, this lesson has laid an important foundation, and we'll be applying many of its concepts during our look at low-pressure systems and the wide variety of weather that they bring (in the next lesson).