Prioritize...
Upon completion of this section, you should be able to describe downbursts (including the difference between a microburst and a macroburst), and how precipitation loading and evaporational cooling can lead to their development. You should also be able to describe why downbursts are a hazard, and in particular explain why microbursts are a threat to aviation.
Read...
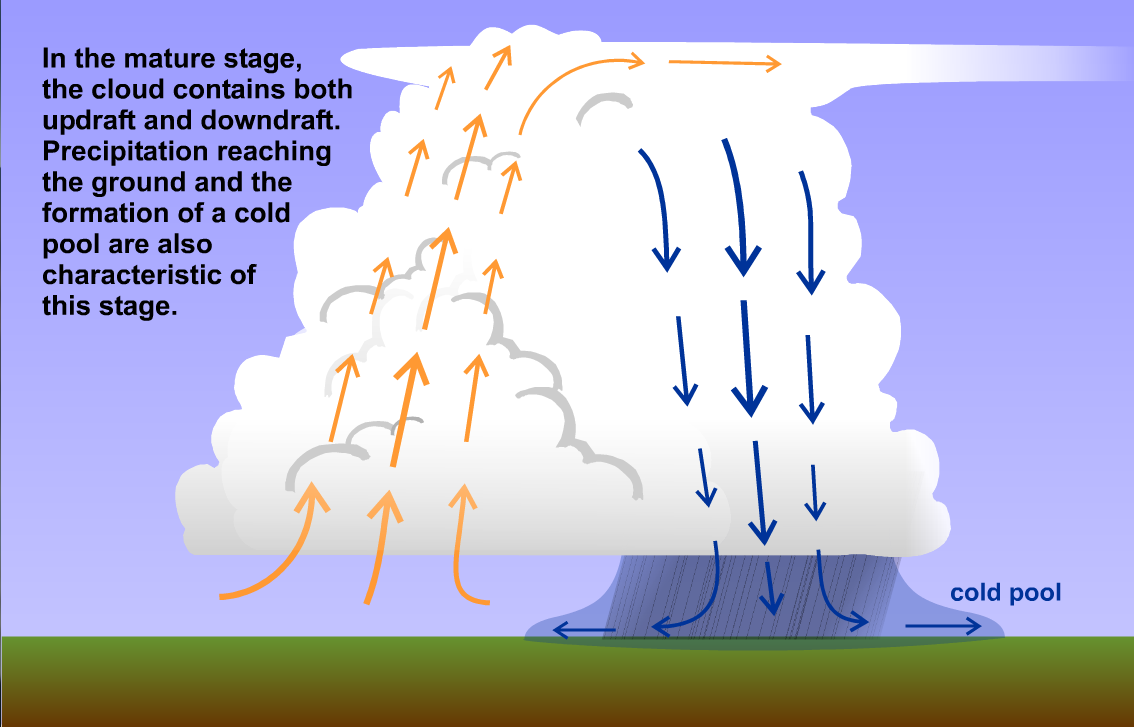
In the not-too-distant past, airline passengers faced a mysterious menace in the sky. This menace was responsible for at least five fatal airline crashes in the 1970s, and several more in the 1980s. The mysterious menace? Downbursts -- a strong downdraft of air that causes an outflow of damaging, straight-line winds at or just above the ground. Remember that all thunderstorms have downdrafts, which cause cool air to rush out from the "splashdown" point, but sometimes downdrafts can become very strong, which leads to an outflow of damaging winds at the surface that characterizes downbursts (winds can exceed 100 miles per hour). This raw video from WFAA TV, showing the aftermath of the crash of Delta Airlines flight 191 on August 2, 1985 on approach to Dallas-Fort Worth Airport, is a testament to just how devastating the impacts of downbursts can be for aircraft.
I'll return to the risks posed by downbursts to aviation later, but for now, let's cover a little more about what downbursts are and what causes them. For starters, downbursts are separated into two categories:
- Microbursts: small downbursts, with a horizontal scale of damaging winds less than four kilometers (about 2.5 miles)
- Macrobursts: larger downbursts with a horizontal scale of damaging winds greater than four kilometers (about 2.5 miles)
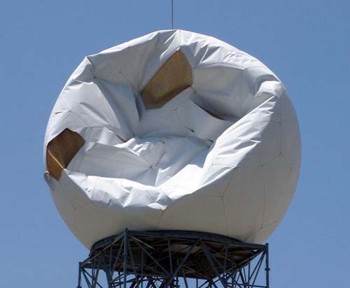
Regardless of size, downbursts can really pack a punch! For evidence, look no further than the photograph on the right, showing the damage done by a microburst to the radome of the NEXRAD at Del Rio, Texas on May 26, 2001. Around 06Z, outflow from a downdraft of a supercell scored a direct hit on the radome and crushed it.
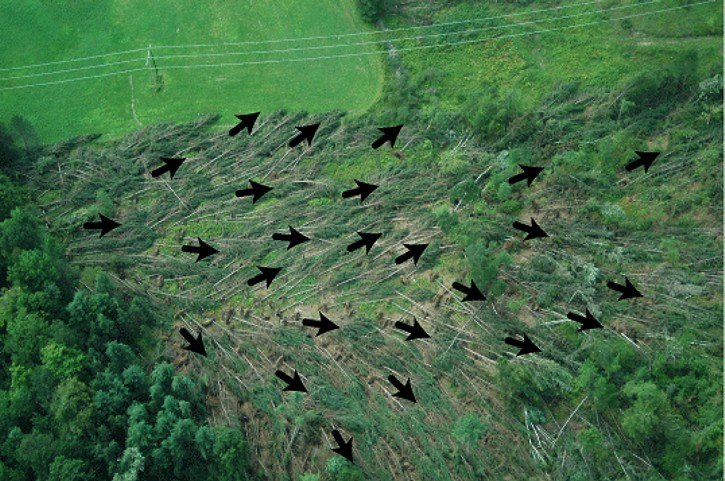
Prior to the 1970s, nobody really knew what downbursts were, and many cases of thunderstorm wind damage that were actually caused by downbursts were just assumed to be from tornadoes. But, during an aerial survey of damage in the aftermath of a “super-outbreak” of 148 tornadoes on April 3-4, 1974 Dr. Ted Fujita (who also devised the damage rating scale for tornadoes, which we'll study later in the lesson) noticed a "strange pattern" of tree damage in some places. Unlike damage inflicted to forests by tornadoes (which usually displays evidence of circulation or rotation), there were splotches of damage where hundreds of fallen trees lay in a divergent starburst pattern.
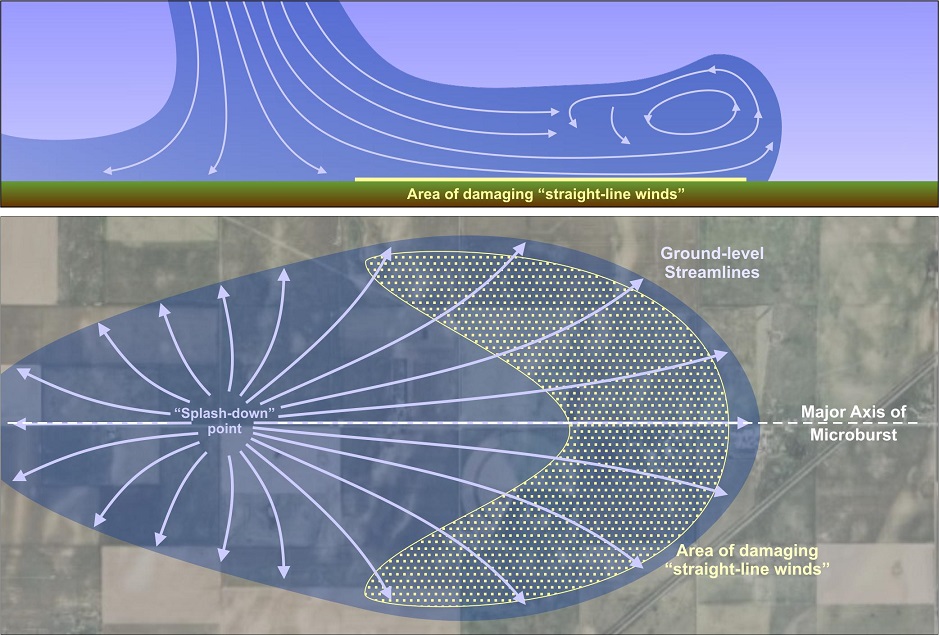
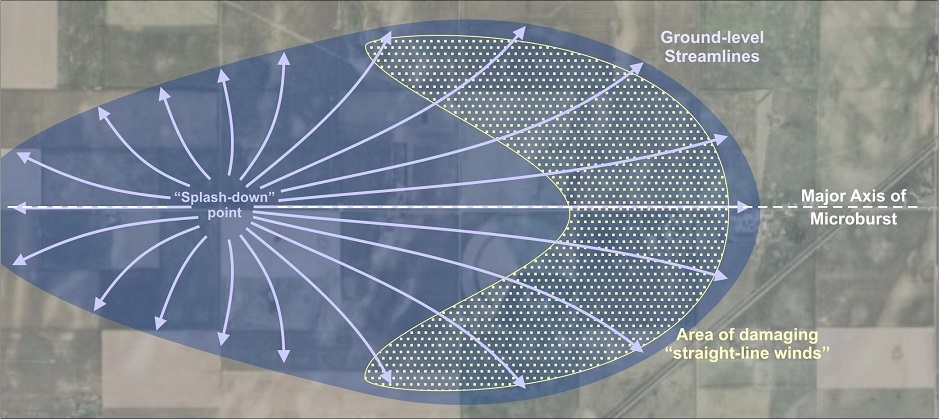
To the public, tornadoes were clearly the culprits, but Dr. Fujita visualized a downdraft "jet" that "hard-landed" at the center of the starburst pattern of damaging straight-line winds, much like water from a kitchen faucet rushes outward after hitting the sink below. Fujita's original concept was largely consistent with the accepted model downbursts that we use today (depicted in the image below, which shows two perspectives of the air flow associated with a downburst). The top part of the image below shows a cross-section view (from the side), showing the downdraft splashdown and damaging winds rushing out behind the leading edge of the cold pool. The bottom part of the image shows a top-down view of downdraft's splashdown point and "streamlines" (arrows tracing the air's movement) spreading out. The area of damaging winds essentially lies just behind the cold pool's outflow boundary (gust front).
The following year, while investigating the fatal crash of Eastern Airlines Flight 66 at JFK Airport on June 24, 1975, Professor Fujita coined the term, "downburst," a "wind system" strong enough to bring down a jet aircraft but small enough to go undetected by our network of surface weather observations. In the following years, Dr. Fujita's research helped make the distinction between macrobursts and microbursts. The most intense downbursts can produce winds that exceed 60 meters per second (approximately 134 miles an hour). Indeed, downbursts are responsible for the record wind gusts at many inland cities or towns. At State College, Pennsylvania, for example, the all-time record wind gust is 95 miles an hour from a downburst on July 23, 1991. Such wind gusts can easily down trees, damage buildings, and pose tremendous danger to aircraft landing (or parked) at airports.
So, what exactly causes downbursts? We're going to focus on two main culprits -- precipitation loading and evaporational cooling. As a reminder, precipitation loading is the suspension of hail, raindrops, graupel, snow crystals, etc., by updrafts in thunderstorms. Basically, precipitation loading is a real "drag." The increasing weight of graupel, hail, and liquid water may trigger or enhance a downdraft simply by dragging down the air as it descends. As a result, precipitation loading can be a mechanism that generates strong downdrafts once the weighty bundle of precipitation particles abruptly plummets to earth (and drags air down with it).
In light of this observation, it stands to reason that forecasters can use cross sections of radar reflectivity to identify short-term potential for downbursts (particularly microbursts). To see what I mean, check out this loop of radar cross-sections from the radar at Salt Lake City, Utah radar spanning from 2226Z to 2250Z on July 10, 1997. Distance in nautical miles is labeled along the bottom of the cross-section, while altitude in thousands of feet is labeled along the left side. The cross-section indicates that a storm formed about 20-25 nautical miles from Salt Lake City (initially there's a small core of 29 dBZ reflectivity above 14,000 feet), and as precipitation loading continued, the core reflectivity increased to 34 dBZ and descended to the ground. The anemometer at the Salt Lake City Airport measured a gust of 49 knots (57 miles per hour), but stronger wind gusts likely occurred closer to the splashdown point (especially within four kilometers).
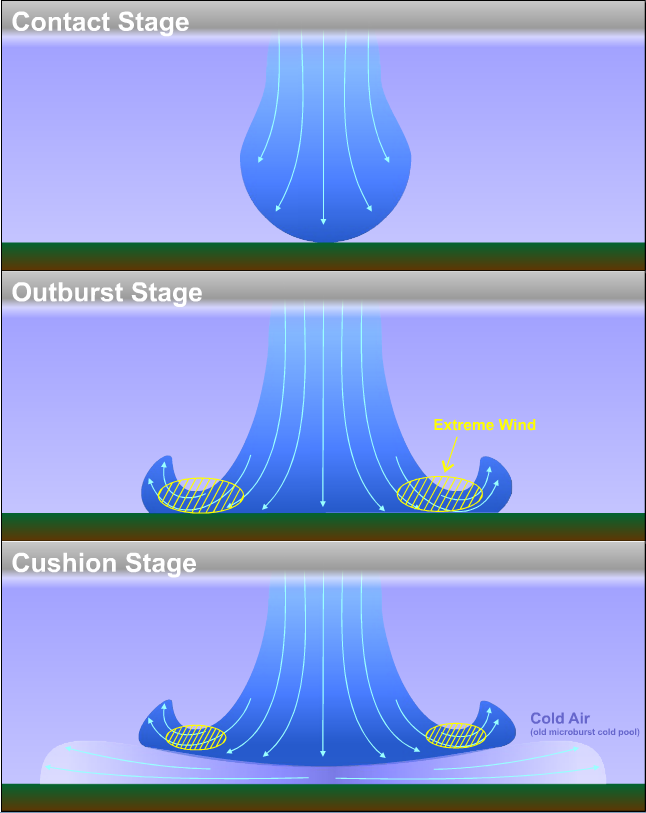
Essentially, you can think of a downburst as having three distinct stages (depicted in the image below). First is the "contact stage," when the downdraft initially makes contact with the ground. Next comes the "outburst stage", when wind rushes out from the splashdown point, potentially causing damage. Finally, comes the "cushion stage," when the cold pool at the ground acts as a "cushion" of sorts: The cold pool becomes thick enough and cold (dense) enough that the downdraft can no-longer penetrate to the surface because air parcels in the downdraft become warmer than their surroundings near the ground, making them positively buoyant and halting their downward acceleration.
If you watch this time lapse of a microburst, you should be able to liken it to the classic model above. You can see a large bundle of precipitation accelerating downward in the downdraft and really get the sense of air rushing outward after the downdraft splashes down at the ground. Storms can produce multiple downbursts during their lives, and this storm time-lapse over Columbus, Ohio from August 28, 2016 is a great example. If you watch carefully, you can see a few bundles of precipitation dropping toward the ground, including a really dramatic one that starts around 25 seconds in (it's a pretty awesome time lapse, which even includes a bonus rainbow!). Watching these videos also gives you a sense for why some refer to microbursts as "rain bombs," although that's not a scientific term.
Evaporational cooling contributes to downdraft speeds as well, because it increases the density of air parcels (increasing negative buoyancy) and aiding their downward acceleration. While most microbursts are "wet microbursts," (meaning that heavy rain is observed when the microburst occurs, despite some evaporation along the way), occasionally "dry microbursts" can occur, too, in which little, if any rain reaches the ground. In a dry microburst, very low relative humidity beneath the cumulonimbus cloud favors net evaporation of raindrops and prime conditions for evaporational cooling, which causes large negative buoyancy and downward acceleration. Most, if not all, raindrops don't survive to the ground before evaporating in a dry microburst. I should also add that melting of ice particles also contributes to negative buoyancy (melting requires energy, and is a cooling process much like evaporation), and may pay a particularly important role in the development of negative buoyancy in downdrafts associated with wet microbursts.
In addition to the threat posed by downbursts to people and property, microbursts in particular pose a huge threat to airplanes taking off or landing. The threat comes from a rapid change in wind direction (horizontal wind shear) experienced by the aircraft (for a visual, imagine a plane flying from right to left through this idealized microburst while trying to land). When flying through a microburst, an airplane experiences strong headwinds, which causes the airplane to gain lift as more air moves past the wings. This added lift causes pilots to point the nose of the aircraft down, but then suddenly the headwind changes to a tailwind after the aircraft passes the downdraft's splashdown point. With strong tailwinds moving along with the aircraft, less air moves over the wings, greatly reducing lift. The aircraft quickly loses altitude and pilots simply can't adjust fast enough, resulting in tragedies like the 1985 crash of Delta Flight 191 mentioned above.
Fortunately, years of research have led to the installation of systems to detect wind shear from downbursts at most major airports. The advent of Doppler radar made such systems possible, given that it can detect air movement, and with modern detection systems in place and better pilot training, air travel is now much safer than it was just a few decades ago. Downburst-related airline incidents have declined sharply (including a 20+ year stretch without any in the U.S.) -- a clear success of the application of meteorological science.
While the field of aviation is much better at anticipating and avoiding microbursts, they can still take the public by surprise. What steps does the National Weather Service take to advise the public of such risks posed by impending thunderstorms? We'll explore that in the next section. Read on!