Prioritize...
After completing this section, you should be able to define ensemble forecasting and ensemble member, and discuss the main advantages of using ensemble forecasts.
Read...
Given that there's no such thing as a perfect computer model forecast, meteorologists obviously can't rely on just one flawed computer model. Instead, they use many flawed computer models in an effort to understand the range of possibilities of future weather, and to better understand which outcomes are more likely than others.
All weather forecasts have some uncertainty associated with them, and a chief way that weather forecasters deal with uncertainty is through the use of ensemble forecasts. At the most basic level, ensemble forecasts are just a set of different computer model forecasts all valid at the same time. Meteorologists use two basic types of ensembles:
- ensembles based on many different computer models (each with their own unique flaws)
- ensembles based on many runs of one computer model started with slightly different initialization data

The ensemble forecasts that meteorologists use fall into one of these two categories, or a combination of the two (some ensembles actually make use of different models and slightly different starting conditions). Having access to ensemble forecasts from computer models essentially gives forecasters many looks at different possibilities for an upcoming weather situation. If the advantages of seeing many possibilities doesn't make sense to you initially, imagine you're competing in an archery contest. Would you rather shoot one arrow at a target (left target) or increase your chances of hitting the bull's eye by shooting a quiver full of arrows (right target)?
Well, having access to only one computer model forecast (or choosing to look at only one) is like an archery contest that allows a forecaster only one shot at the target. But, you can think of ensembles as an archery contest that allows a forecaster to shoot a quiver full of arrows at the same target. For a pending forecast fraught with uncertainty, utilizing ensembles gives forecasters a better chance of hitting at least something (akin to minimizing forecast error). Ensemble forecasts can be used to show meteorologists the probability of various forecast events happening (like, the chance that the temperature reaches 90 degrees Fahrenheit, or the chance that at one inch of rain or more falls in a given time period), so they're very useful tools.
But, before we talk a bit more about how ensemble forecasts are used, I want to briefly discuss how they're created. We'll focus on the second type of ensemble listed above, in which one computer model is run many different times with slightly different initial conditions. To keep going with the archery analogy, what allows us to shoot more than one "arrow" at the target? We know that the initial conditions fed into the model lie at the heart of the problem of model forecast errors (imperfect calculations and parameterizations don't help either), and the imperfect initializations can inject huge uncertainties into a pending forecast.
Since the model's initialization has errors, we "tweak" certain parts of the initialization data (say, making small adjustments to initial temperature or pressure observations) and run the model again to see how the forecast differs. This process is typically repeated at least a couple dozen times (or more, depending on the computer model), to generate a set of ensemble member forecasts. For the record, each individual model run based on "tweaked" initial conditions is called an ensemble member.
If all or most of the tweaked model runs come up with similar forecast solutions, meteorologists have a relatively high degree of confidence in that day’s forecast. If, however, the tweaked model runs predict vastly different forecasts, then forecasters know that the uncertainty in the forecast is great, and they have less confidence in the forecast. Dr. Jon Nese created a short video (3:44) explaining the basics of ensemble forecasting for Penn State's Weather World television program, which you may find helpful in reinforcing the basic principles of ensemble forecasting that I've just described.
If you've watched weather coverage on television, or if you follow it closely online, there's a pretty good chance you've seen ensemble forecasts at some point. Perhaps the ensemble forecasting product that's most commonly seen by the public might be "spaghetti plots" of hurricane track forecasts. A look at the spaghetti plot of forecast tracks for Hurricane Florence (2018) probably gives you an idea of why they're called spaghetti plots -- squiggly lines (that resemble spaghetti noodles) everywhere! For the record, this plot of track forecasts comes from the ensemble run by the European Centre for Medium-Range Weather Forecasts. It's a very powerful ensemble that contains more than 50 members. That means the graphic below shows more than 50 possibilities for Florence's track, based on slightly different model initializations (each line on the graphic represents one member's forecast).
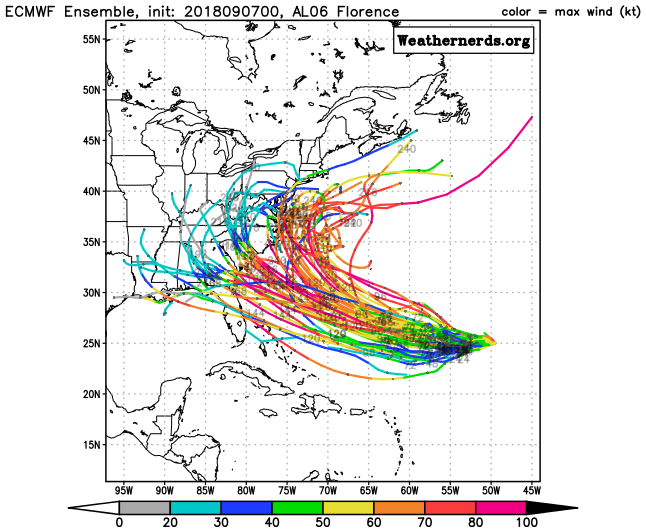
What main messages might a meteorologist take from the spaghetti plot above? Well, for starters, the point toward the right side of the graph where all of the "noodles" come together is the starting point of the forecast. That's the location where Florence was located when the model was run. But, note how the spread between the forecast tracks grows larger farther away form that point, and especially spreads out closer to the United States (for forecast times generally 6 to 10 days after this ensemble was run). That's a reflection of the increasing uncertainty in the forecast further into the future. A forecaster could conclude that it's very likely that Florence will at least come close to the U.S. coast (close enough that at least some impacts from the storm are very likely), but could a forecaster guarantee a specific point for landfall? Nope. That's not something that's predictable nearly a week before a hurricane makes landfall, and the wide spread of ensemble member forecasts indicates why.
While pinpointing a specific spot or time for landfall based on this ensemble forecast is impossible, a meteorologist can still use their knowledge of hurricane structure and hazards, the factors that steer hurricanes, certain known model biases, etc. to perhaps identify some outcomes that may be more likely than others (to narrow the options down somewhat). For example, even recognizing the fact that impacts somewhere along the Carolina Coast were likely (from storm surge, heavy rain, and strong winds) is useful information for helping people to prepare when potential landfall is still nearly a week away (even if the specifics of landfall aren't certain).
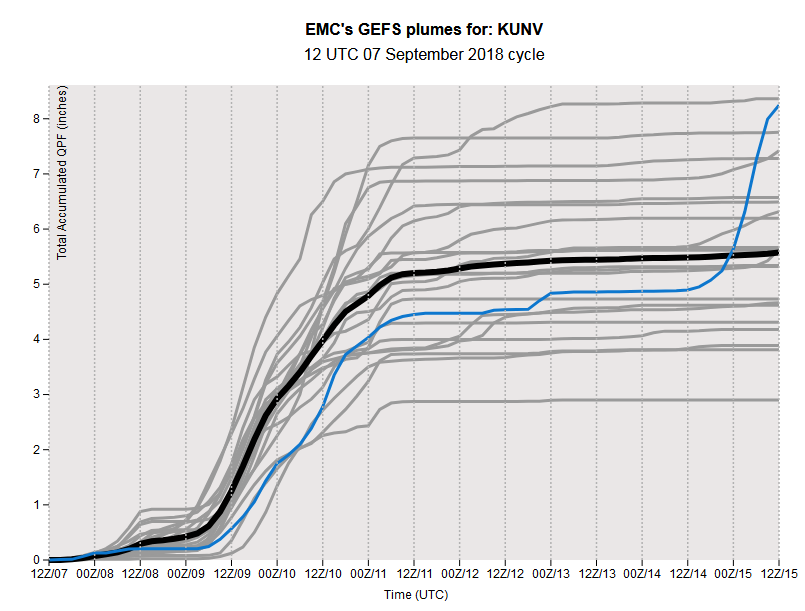
In addition to spaghetti plots of hurricane track forecasts, ensemble forecasts for just about any forecast variable exist. For example, here's a “plume” diagram that shows the predictions for rainfall at University Park, Pennsylvania (where Penn State's main campus is located) based on a set of ensembles run at 12Z on September 7, 2018. Time runs from left to right along the bottom, and along the left is the amount of rain in inches. Each line represents one ensemble member's prediction for cumulative precipitation. A large spread in ensemble forecasts exists, ranging from a little less than three inches of rain to as much as near eight inches (all in about a three-day period). For the record, the thick black line is the mean (average) of all of the ensemble member forecasts, which sometimes forecasters find to be a useful middle ground forecast. In this case, the ensemble mean forecast was for a little more than five inches of rain from the remnants of Tropical Storm Gordon (for the record, the remnants of Gordon ended up dropping 5.84 inches at Penn State's main campus, so the ensemble mean forecast was pretty good here).
Weather forecasters also sometimes find the ensemble mean forecast useful for evaluating the overall weather pattern one to two weeks into the future (more useful than any single model run, anyway). So, ensemble forecasts are a critical tool in modern weather forecasting, and we have advances in computing power to thank for the fact that we can run ensemble forecasts at all. Running the same model many times with slightly different initial conditions requires a lot of computing power! But, now that we've discussed how computers have revolutionized weather forecasting and briefly touched on some of the main tools that meteorologists use in making forecasts, let's start exploring just how good (or bad) the resulting forecasts are. Read on.