Prioritize...
When you've completed this section you should be able to define absolute error, forecast "skill" compared to climatology, and probability of precipitation. You should also be able to compare the accuracy of temperature and precipitation forecasts.
Read...
With all of the knowledge of the atmosphere and sophisticated computer modeling tools that have been developed, just how good are weather forecasts? Well, for starters, we have to set some expectations on what exactly is a "good" forecast. If your idea of a "good" forecast is that every single aspect of the weather forecast is perfect (everything is timed to the exact minute, temperatures are exactly right, etc.), then by those unrealistic standards, all weather forecasts are wrong in some way. As mentioned in the previous section, a forecast for the exact landfall location of a hurricane a week into the future, for example, is unlikely to be exactly correct. But, most weather forecasts, when properly expressed and communicated, are accurate enough to be useful.
Before we get into our discussion about the accuracy of various forecasts, we have to cover a couple of definitions that describe some common ways that forecasters track forecast accuracy:
- absolute error tells us about the size of the forecast error based on the difference between the forecast conditions and what actually happens. Using temperature as an example, note that absolute error does not tell you whether the forecast was warmer or cooler than what actually happened; it only tells you about the size of the error. In other words, a forecast that is 5 degrees Fahrenheit too high would have the same absolute error as a forecast that is 5 degrees Fahrenheit too low.
- skill compared to climatology: Forecasts that have "skill" are more accurate than a generic "climatology" forecast of 30-year normal conditions. If the forecast is less accurate than using a forecast of climatological normals, then the forecast has no skill and is essentially useless.
Temperature forecasts are often reasonably accurate (have absolute errors of 3 degrees Fahrenheit or less) a couple of days into the future, but the further into the future the forecast goes, generally the less accurate it will be. In other words, if you see a weather forecast for a high of 85 degrees Fahrenheit tomorrow, much more often than not, the actual high will be within a few degrees of that. But, as time goes on, accuracy suffers. If you see a forecast for a high temperature of 85 degrees Fahrenheit on a day a few weeks into the future, the absolute error is likely to be much larger (possibly 10 degrees Fahrenheit or more). Based on what you learned about forecast errors growing in time in computer models, it should come as no surprise that specific forecasts eventually become erroneous to the point where the forecasts are no longer useful. For this reason, for longer-range forecasts (say, more than a week into the future) meteorologists often evaluate forecast quality based on skill compared to climatology instead of absolute errors.
Longer range forecasts (even weeks into the future) can still be accurate and useful, as long as the forecast is less specific. For example, weather forecasters may not be able to accurately predict the exact high temperature two weeks from now, but they may be able to correctly say that the weather pattern a few weeks from now favors warmer than normal conditions. Such a forecast would have skill (compared to climatology) and may be helpful to event planners, retailers, farmers, etc.
Temperature Forecasts
Within a couple of days, temperature forecasts have absolute errors of a few degrees or less (on average), with accuracy gradually decreasing after three days. The graph below shows mean absolute errors for maximum temperature forecasts by the Weather Prediction Center (the U.S. government's main general weather forecast center) and shows this gradual decline in accuracy from three to seven days. Seven-day forecasts, marked by the black line, have the largest mean absolute errors, of about 5 to 6 degrees Fahrenheit. But, even a three- or four-day maximum temperature forecast is, on average, within about 3 to 4 degrees Fahrenheit of what's observed (red and green lines). Not bad!
The trends on the graph also indicate clear improvement in forecasts in recent decades. On average, a maximum temperature forecast for five days into the future is about as accurate today as a three-day forecast was in 2002. A seven-day maximum temperature forecast is about as accurate today as a three-day forecast was in 1990. So, there's no doubting the improvement! In case you're interested, here's the same graph, except for minimum temperatures. The pattern of forecast improvement is basically the same, although the average absolute errors are a bit smaller.
Not surprisingly, more than seven days into the future, the accuracy of specific temperature forecasts fades pretty quickly, and often by 9 or 10 days into the future, forecasts lose skill completely (meaning, on average, they have larger absolute errors than just using the date's normal high and low temperatures as the forecast). But, you still may encounter forecasts for specific daily high and low temperatures more than 10 days into the future on your favorite weather app or website (some will even attempt to predict daily highs and lows several weeks or even months into the future). Do you think such forecasts are valuable? I suppose the answer to that question is somewhat in the eye of the beholder, but these very specific long range forecasts typically have no skill. In fact, as a class project, some meteorology students at Penn State put some of these specific long-range forecasts to the test to show that simply knowing climatology would give you a better forecast weeks into the future.
Precipitation Forecasts
Generally speaking, predicting the details of precipitation is more difficult than predicting temperature. That's why precipitation forecasts are often expressed as a probability (or chance) of precipitation, which describes the likelihood that a given point in a forecast area will receive measurable precipitation (at least 0.01 inches) in a certain time period. So, a 40 percent chance of rain tomorrow means there's a four in ten chance that any point (your backyard, perhaps) in a forecast area will receive at least 0.01 inches of rain tomorrow. Alternatively, if the same forecast scenario occurred ten times, at least 0.01 inches of rain would fall on four days at any point in the forecast area, and no measurable rain would fall the other six days.
Weather forecasters often use probabilities because whether or not precipitation falls at your location may not be a sure thing. Precipitation formation sometimes depends on many small-scale processes that we can't measure very well, which ultimately leads to error in a forecast. For example, just one day in advance, forecasters won't know the exact location or time when pop-up thunderstorm will occur because the processes involved occur on small scales and are not predictable that far in advance. But, they may know that scattered thunderstorms will develop in a particular portion of a state or region.
Meteorologists have several metrics for keeping track of the accuracy of probabilistic forecasts, but one common assessment for the accuracy of precipitation forecasts (especially forecasts for heavy precipitation) is called the "threat score." You need not worry about the details of the calculation, but the basic idea is that it's based on the ratio of the area where the forecast was accurate to the area where the forecast didn't verify correctly. For a visual, check out the image below, where the Forecast area (F) is the region where heavy precipitation was predicted and is shaded in red. The observed area (OB) indicates the region where heavy precipitation fell and is shaded in green. The hatched area, C, represents the region where the forecast for heavy precipitation was correct.
As with temperature forecasts, threat scores have improved greatly over time. Indeed, a three-day forecast for at least one inch of precipitation is about as accurate today as a one-day forecast was in the late 1980s. That's the good news. The bad news is that extreme precipitation events present numerous challenges to forecasters (and computer models) because of the importance of small-scale processes that we can't measure or model perfectly. Threat scores indicate that the Weather Prediction Center's 24-hour forecasts for at least one inch of precipitation one day into the future get only a little more than half the area correct, on average. Two- and three-day forecasts for 1 inch of precipitation over a 24-hour period get less than half the area correct, on average. So, the accuracy of extreme precipitation events (in locating the exact areas or timing of heaviest precipitation) dwindles much more quickly than temperature forecasts, and as a consequence, the details of precipitation forecasts can change quite a bit, even just a few days into the future.
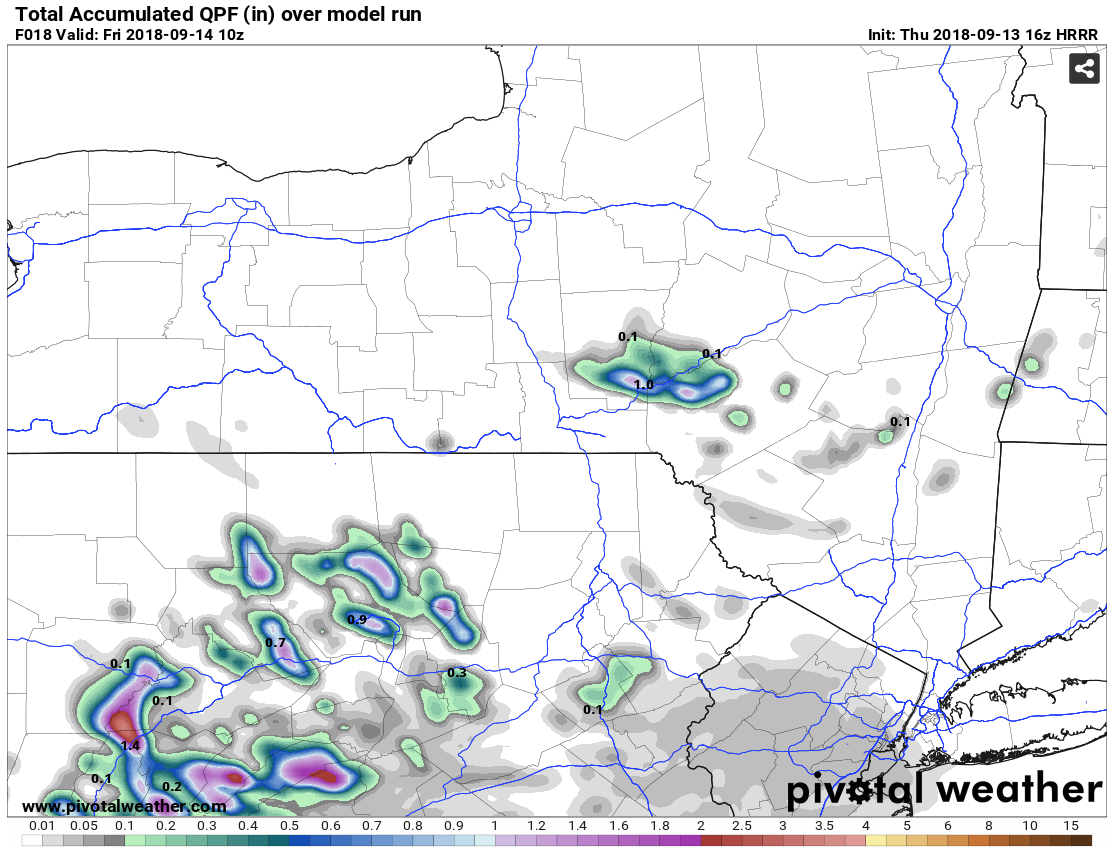
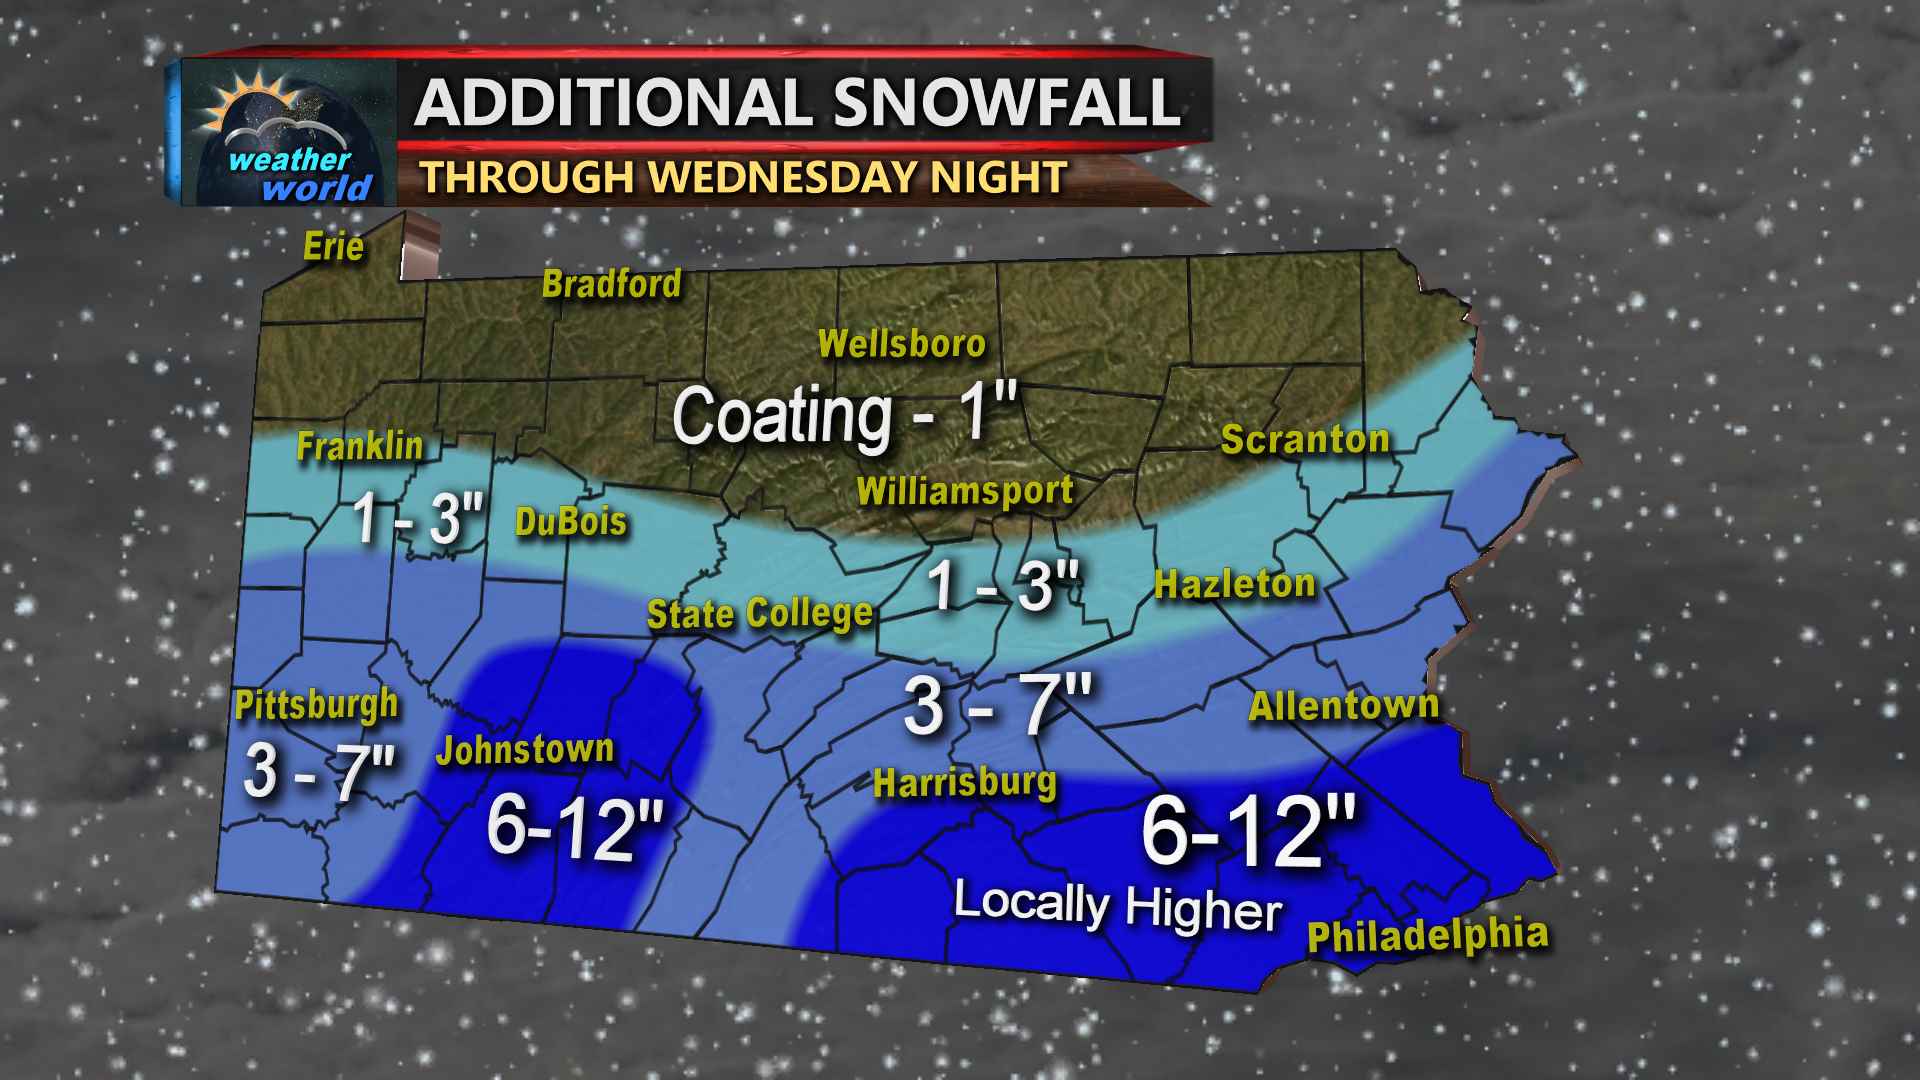
Keep that fact in mind when you see very specific precipitation forecasts. Precipitation forecasts to the tenth or hundredth of an inch aren't hard to find on television weather forecasts or online, but you should be leery of the exact values depicted. At best, the forecasts might highlight the general areas where precipitation (or heavier precipitation) might fall, but the exact values at specific locations will likely be wrong. Take this example of an 18-hour model precipitation forecast from September 13, 2018. The "splotchy" nature of the precipitation suggests difficult-to-predict scattered showers and thunderstorms. The model is suggesting that localized areas of heavy rain are possible, but I wouldn't trust their exact locations or amounts because they're often wrong (at best, they're close). The same idea goes for snowfall forecasts: When you see snowfall forecast maps with very specific totals (to the inch or tenth of an inch), those specifics are likely to be wrong. When forecasting snow, most forecasters prefer to use ranges to reflect the uncertainty in the forecast and to account for the fact that snowfall totals can vary quite a bit locally based on terrain or the location of small bands of heavier snow.
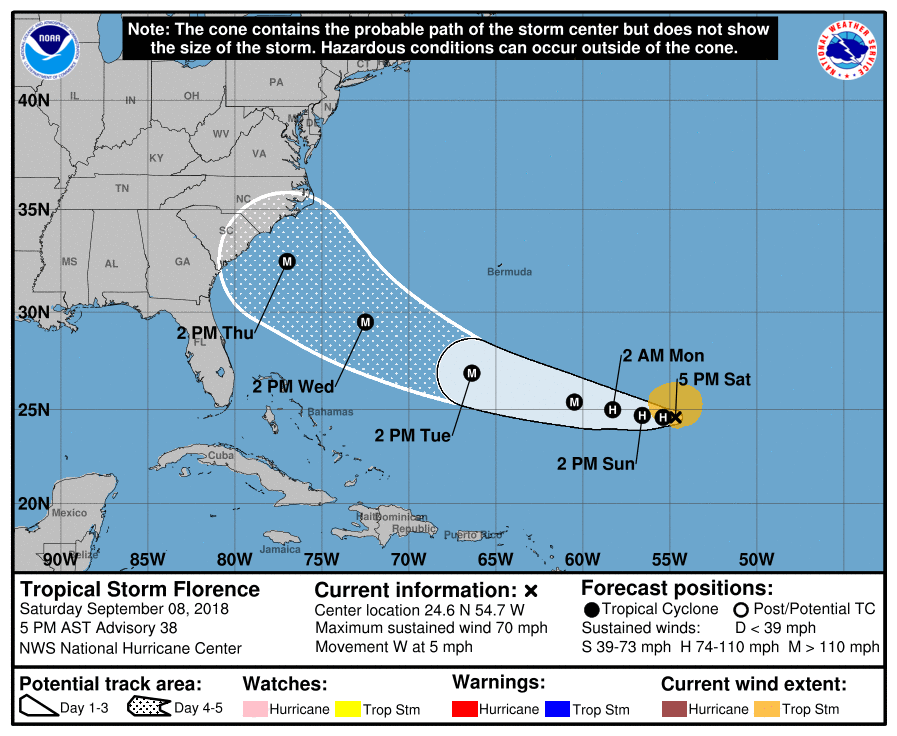
Generally, you should be wary of highly specific weather forecasts for anything more than a few days into the future (especially for precipitation or for any extreme event). However, forecasts several days into the future (or even longer) can still contain useful (but less specific) information. This National Hurricane Center forecast for Hurricane Florence (2018) made six days before it ultimately made landfall near Wrightsville Beach, North Carolina let people in the Carolinas know that a hurricane was likely heading their way. Was the forecast perfect? Not quite, but it was still very good and helped people prepare.
The bottom line is that, if you have reasonable expectations about how good weather forecasts are, you'll find that most forecasts are quite useful, especially if they're communicated in a way that emphasizes the parts of the forecast that are more certain than others. But, let's face it. Not all weather forecasts are created equal. The discussion of forecast accuracy on this page centered around forecasts that are created by humans (using computer models as part of the process, of course). These human-generated forecasts tend to be more accurate than those created solely by computers. But, not every forecast you encounter on a daily basis has a human involved in the process. Up next, we'll talk about some common sources of weather forecasts and how they're made. Read on.