Prioritize...
Upon completion of this page, you should be able to discuss three scenarios with greater-than-normal forecast uncertainty, which can lead to large errors in specific weather forecasts.
Read...
With the stats and discussion so far in the lesson, you should have the impression that:
- most short-term weather forecasts (a few days or less into the future), while not perfect, are accurate enough to be useful
- weather forecasts several days into the future or more can still be accurate and useful if they're less specific about details (exact temperatures, exact timing of precipitation, exact precipitation amounts, etc.)
- the perception of forecast accuracy suffers sometimes because of the sources people use for their forecasts (apps that only show a single weather icon with no further context or that give highly specific information too far into the future, for example)
But, while most weather forecasts that are communicated appropriately are accurate enough to be useful, sometimes weather forecasts (even short-term ones) go very wrong. My goal in this section is to present a few common scenarios when this can occur, so that if you're following along with weather coverage, you may be able to spot instances when the weather forecast for your location has a lot of uncertainty and may go awry. We're going to focus on three scenarios -- weather patterns with large gradients, cases where small-scale processes (like atmospheric convection) are major factors in the weather, and cases where the conditions depend highly on the exact path of a strong mid-latitude or tropical cyclone.
Beware of Large Gradients
I've said a few times throughout the course that large gradients are areas where "interesting" weather tends to happen, and unfortunately, large gradients tend to present huge forecasting challenges. Why is that? As you may recall, a gradient is the change in some variable over a certain distance, so large gradients mean that large changes exist over a short distance. As an example, check out the observed snowfall analysis from January 22 through January 24, 2016 from the "Blizzard of 2016." Note the large gradient in snowfall amounts along the northern edge of the storm's wake.
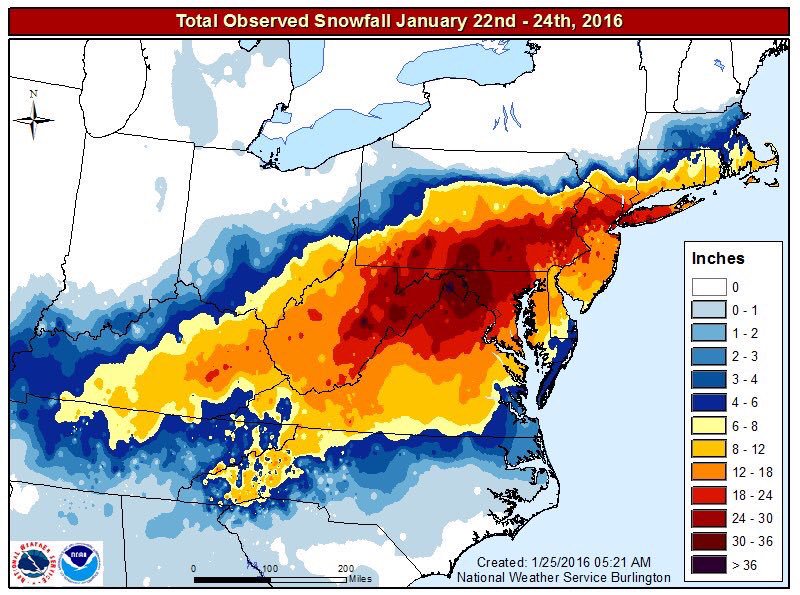
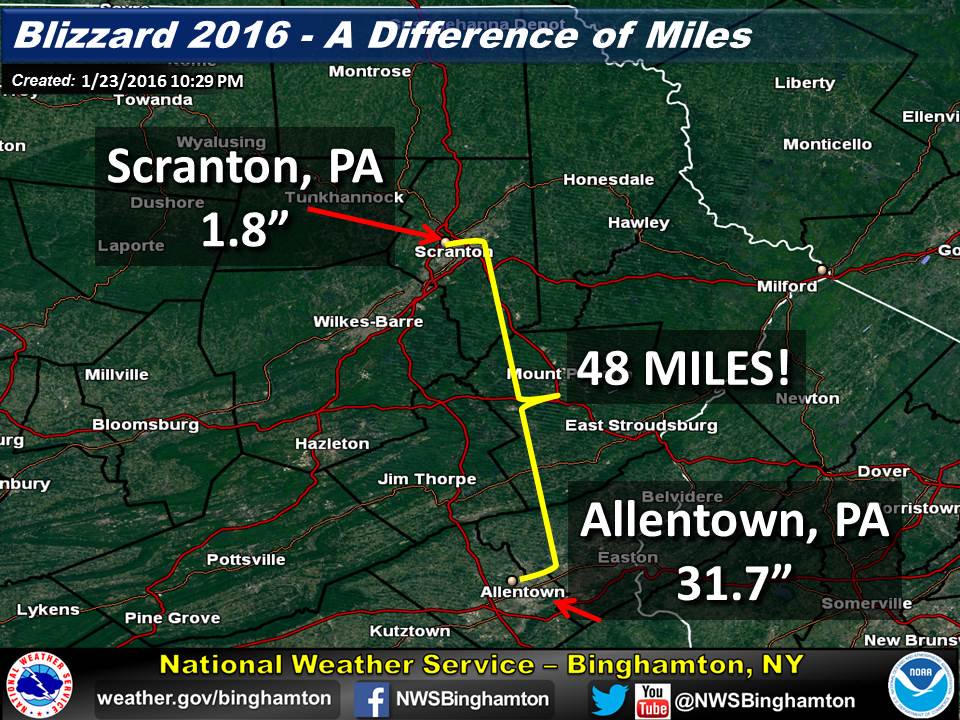
If you focus on Pennsylvania, in the central part of the state, some areas received more than 20 inches of snow, but along the northern border (less than 100 miles to the north), no snow fell at all! As an extreme example, Scranton, Pennsylvania received less than 2 inches of snow, while Allentown (about 50 miles to the southeast), received more than 30 inches! Such rapid changes in snowfall over a small distance mean that very subtle (and hard-to-predict) changes to the storm can drastically change the amount of snow that falls at any location within the large gradient. In this case, a slightly more northern track of the storm would have meant feet of snow for Scranton, instead of just 1.8 inches.
Indeed, areas along the western and northern edges of big East Coast snow storms (and other strong mid-latitude cyclones in the Northern Hemisphere) can be areas of large forecast uncertainty, and the confidence in the specific forecast at any single point is pretty low. The predictions for very heavy snow in the "heart" of the storm tend to have higher confidence. So, if you find yourself near the edge of where significant precipitation may fall (in other words, in a region with a large gradient), keep in mind that your forecast is particularly challenging, and small changes in the storm's behavior could mean big differences in the weather you experience.
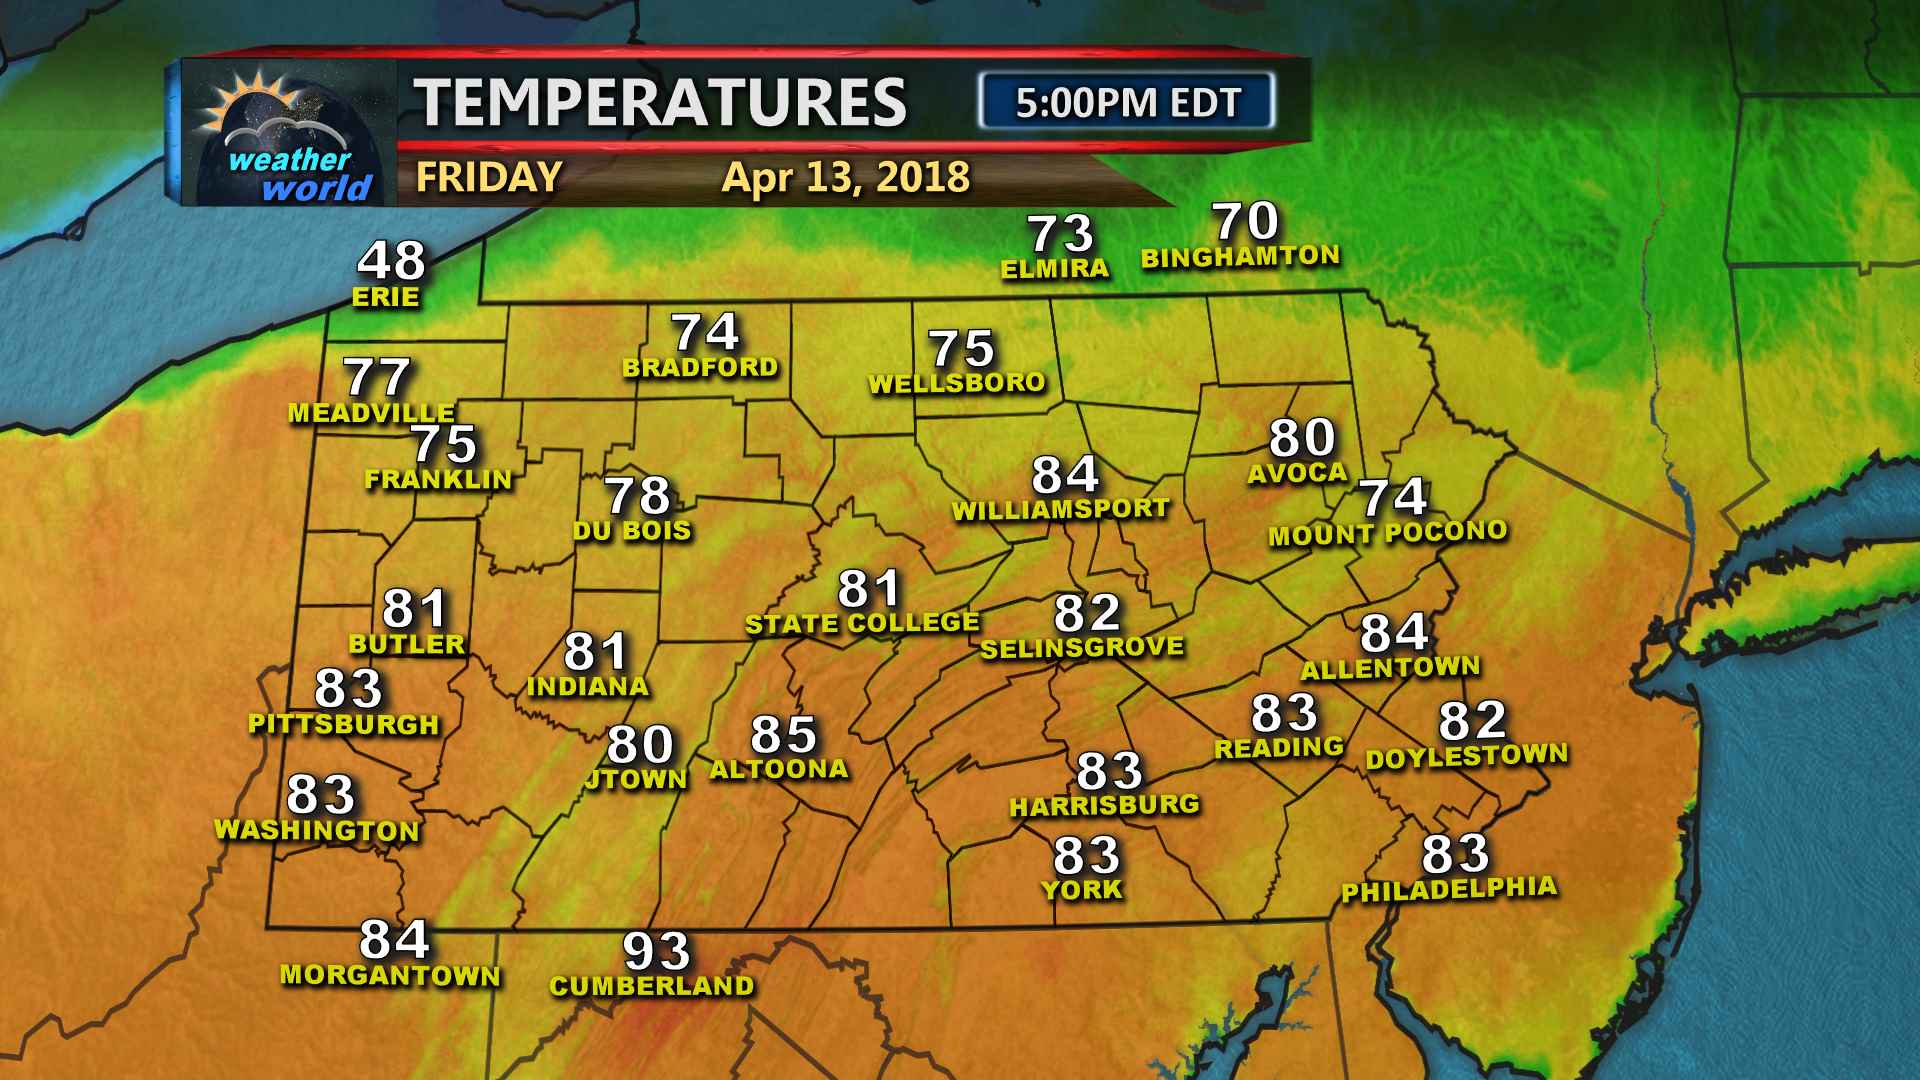
The same can be said for regions with large temperature gradients (where strong fronts are located). For example, a long stationary front that extended from off the New England Coast back to a low near the Nebraska / Kansas border on April 13, 2018 (check out the 15Z analysis of sea-level pressure and fronts) had a large temperature gradient associated with it. Temperature forecasts within the large gradient were particularly challenging because of the large changes over a small distance.
Unless a forecaster or computer model predicted the gradient exactly right (not likely, even a day in advance), there were bound to be some "surprises" in the temperature forecast. In fact, parts of Pennsylvania made it well into the 80s, while it was just 48 degrees Fahrenheit in Erie, with a chilly northeasterly wind blowing off the waters of Lake Erie (the lake waters are still quite chilly in April). Temperatures ranged from the 40s to the 70s within one county, and the sharp gradient continued toward the east along the southern tier of New York. Good luck to the forecasters who had to deal with that! So, when you're located in an area where a strong front is located be aware that your temperatures could change quickly, and that the temperature forecast for your region is more uncertain than usual. It's a good idea to prepare for a wide range of temperatures because it could easily end up much warmer, or cooler, than the forecast says (or if you have to travel even a small distance, temperatures could be drastically different). So, beware of gradients! They're areas where big weather changes happen over small distances, which can wreak havoc on a forecast.
Small-Scale Weather
Scenarios in which small-scale weather processes are very important in the forecast can also give weather forecasters headaches. What do I mean by "small-scale weather processes"? Atmospheric convection is a good example. On some days, the development of thunderstorms through convection might seem random, because isolated thunderstorm cells seemingly pop up on a whim. But, thunderstorms never really erupt randomly, even if it appears that way. As you learned previously, thunderstorms tend to form when air parcels can become positively buoyant after being given a nudge upward. Sometimes that nudge comes from a large feature, like a cold front, but other times the nudge comes from small areas of subtle low-level convergence. These small, subtle "triggers" are often missed by the network of weather observation sites, and computer models often struggle to simulate them properly.
Because the "triggers" for thunderstorm development aren't measured or modeled very well, confidence in exactly where or when thunderstorms might erupt is often low. Forecasters can often identify a region of the country or state where thunderstorms will likely develop, but pinpointing exactly when and where is more difficult. For example, check out the animation of simulated radar reflectivity from nine consecutive computer model runs. All forecasts in the animation are valid at the same time (00Z on September 22, 2018), and are from the same computer model. The "oldest" forecast in the animation (first frame) is from the model run 60 hours before the valid time, while the "newest" forecast in the animation is from the model run 12 hours before the valid time (last frame). Do you see the changes in the predicted line of storms from model run to model run? The location of the line and the location of the most intense cells jumps around quite a bit.
A take-home message from the animation above is that even sometimes within one day of the development of thunderstorms, the exact locations and intensity aren't clear. In this particular case, a squall line was likely to develop along a cold front, but the exact timing and location of the most intense parts of the line were uncertain, even 12 to 24 hours in advance. Pinning down details gets even harder when thunderstorms are more of the widely scattered "pop-up" variety. In such cases, model forecasts for radar reflectivity often bear little resemblance to each other, as the exact locations of individual thunderstorms jump around a lot. These situations can really cause problems for automated minute-by-minute or hourly forecasts.
Dependency on Major Cyclone Tracks
To some extent, challenges brought about by the exact tracks of major mid-latitude or tropical cyclones are connected to the issues with large gradients that we already discussed. A slightly different low track for the "Blizzard of 2016" for example, would have resulted in vastly different snowfall amounts in the northern half of Pennsylvania in the example above. Similarly, if you're in an area where a change over in precipitation may occur during a winter storm (from snow to sleet and freezing rain, for example), a small deviation in the storm track can change the weather you experience a lot by causing changes in precipitation type either much slower or faster than expected (perhaps leading to much more or less snow than anticipated, respectively).
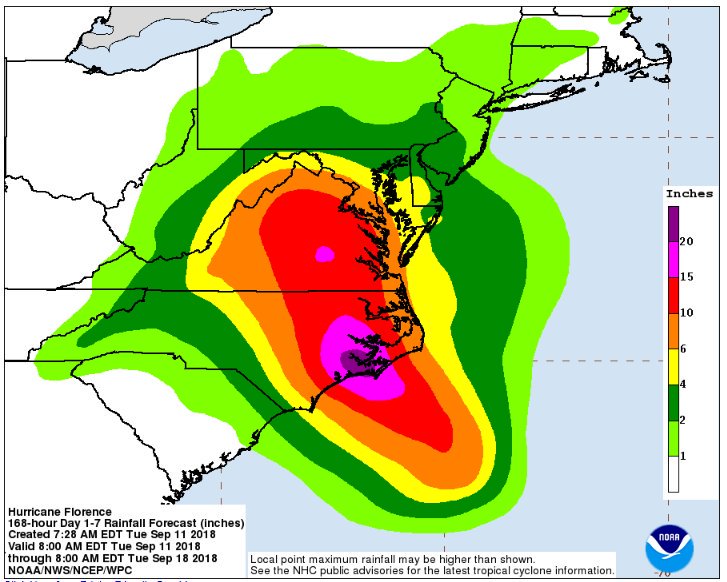
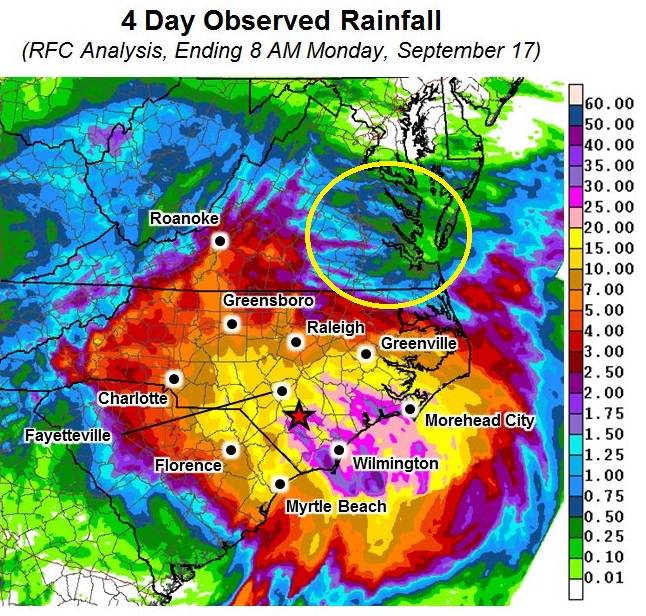
As another example, check out the rainfall forecast for Hurricane Florence (2018) from the Weather Prediction Center, issued about three days before the storm made landfall. Note that much of eastern Virginia was predicted to get anywhere from 6 to 15 inches of rain (orange and red shadings). Now, check out the actual rainfall estimates from Florence, and focus in on the circled area in eastern Virginia. Most of that region received less than two inches of rain (and some areas less than one inch)! The forecast did correctly highlight eastern North Carolina as the area that would see the heaviest rain (a large area of 15 inches or more), but the forecast for eastern Virginia wasn't very good. That's because Florence ended up taking a more southern path once inland, instead of turning immediately northward, which shifted some of the very heavy rain into South Carolina instead of Virginia.
But, what if the storm had come in 50 or 100 miles farther north than it actually did? Some of those areas in eastern Virginia, which didn't see much rain, would have seen a deluge (and serious flooding, most likely). Sometimes, a mere difference of 50 or 100 miles in the path of a mid-latitude or tropical cyclone can mean the difference between catastrophic impacts and impacts that are much more manageable. Unfortunately, errors of 50 or 100 miles are fairly common even just a few days in advance.
The delicate forecast scenarios outlined in this section are the times when highly specific forecasts are most likely to go wrong. They're also the situations when a fully automated forecast or an "icon" on a weather app is most likely to mislead you. When the forecast gets complicated, that's when a human meteorologist can really help by giving additional context and explaining a range of possibilities. So, I think having some trusted weather sources (beyond just an app) can be very useful, especially for those times when high-impact weather may be coming your way. Up next, we'll talk about finding trusted weather sources in the age of social media. Read on!