
Extinction Risk
Ecologists have a great deal of difficulty predicting the future. As we have already described, and as we will see throughout this module, the threats to species today are extremely complex and difficult to quantify. However, because of the importance of predictions in conservation and policy, modeling extinction risk has become a part of the toolkit of ecologists. A wide array of data and methods are applied. However, the key aspect of a model of extinction risk is the population size and the area and the rate with which those parameters are likely to change with projected climate change. Extinction risk models often use climate and environmental projections (temperature drought) from the different emission scenarios (Module 5). Forecasts of extinction often cause great alarm. An infamous case was the 2004 prediction by conservation biologist Chris Thomas of the University of York that up to a million species would become extinct by 2050. The paper in which the models were described has become one of the most scrutinized publications in ecology. The consequent wrangling over technique and interpretation has exposed just how problematic forecasts are.
Without some kind of assessment of risk, however, it is not possible to develop a strategic plan for species conservation backed up by sound environmental policy. The International Union for Conservation of Nature (IUCN) was founded in 1948 with the goal of assessing the magnitude of the extinction threat of modern species and the measures that are being taken towards their conservation. The organization collects the latest ecological data on threatened species and evaluates their status and extinction risk. The IUCN compiles an up-to-date Red List of Threatened Species that summarizes the current status using a set of categories illustrated in the figure below.
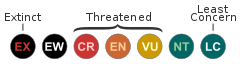
The key categories in the Red List system are Critically Endangered, Endangered, and Vulnerable, and each of these categories is defined by very specific information on changes in the abundance and distribution of the species. For example, here are the requirements for a species to be considered Critically Endangered, quoted directly from the official Red List criteria (this information is provided to give you an appreciation of the metrics, you are not required to remember the details!).
A taxon is Critically Endangered when the best available evidence indicates that it meets any of the following criteria (A to E), and it is therefore considered to be facing an extremely high risk of extinction in the wild:
A. Reduction in population size based on any of the following:
1. An observed, estimated, inferred or suspected population size reduction of ≥90% over the last 10 years or three generations, whichever is the longer, where the causes of the reduction are clearly reversible AND understood AND ceased, based on (and specifying) any of the following:
(a) direct observation
(b) an index of abundance appropriate to the taxon
(c) a decline in area of occupancy, the extent of occurrence and/or quality of habitat
(d) actual or potential levels of exploitation
(e) the effects of introduced taxa, hybridization, pathogens, pollutants, competitors or parasites.
2. An observed, estimated, inferred or suspected population size reduction of ≥80% over the last 10 years or three generations, whichever is the longer, where the reduction or its causes may not have ceased OR may not be understood OR may not be reversible, based on (and specifying) any of (a) to (e) under A1.
3. A population size reduction of ≥80%, projected or suspected to be met within the next 10 years or three generations, whichever is the longer (up to a maximum of 100 years), based on (and specifying) any of (b) to (e) under A1.
4. An observed, estimated, inferred, projected, or suspected population size reduction of ≥80% over any 10 year or three generation period, whichever is longer (up to a maximum of 100 years in the future), where the time period must include both the past and the future, and where the reduction or its causes may not have ceased OR may not be understood OR may not be reversible, based on (and specifying) any of (a) to (e) under A1.
B. Geographic range in the form of either B1 (extent of occurrence) OR B2 (area of 1). Extent of occurrence estimated to be less than 100 km2, and estimates indicating at least two of a-c:
- Severely fragmented or known to exist at only a single location.
- Continuing decline, observed, inferred, or projected, in any of the following:
(a) extent of occurrence
(b) area of occupancy
(c) area, extent, and/or quality of habitat
(d) number of locations or subpopulations
(e) number of mature individuals.
3. Extreme fluctuations in any of the following:
(a) extent of occurrence
(b) area of occupancy
(c) number of locations or subpopulations
(d) number of mature individuals.
4. Area of occupancy estimated to be less than 10 km2, and estimate indicating at least two of a-c:
a. Severely fragmented or known to exist at only a single location.
b. Continuing decline, observed, inferred, or projected, in any of the following:
(i) extent of occurrence
(ii) area of occupancy
(iii) area, extent, and/or quality of habitat
(iv) number of locations or subpopulations
(v) number of mature individuals.
c. Extreme fluctuations in any of the following:
(i) extent of occurrence
(ii) area of occupancy
(iii) number of locations or subpopulations
(iv) number of mature individuals.
C. Population size estimated to number fewer than 250 mature individuals and either:
- An estimated continuing decline of at least 25% within three years or one generation, whichever is longer, (up to a maximum of 100 years in the future) OR
- A continuing decline, observed, projected, or inferred, in numbers of mature individuals AND at least one of the following (a-b):
a. Population structure in the form of one of the following:
(i) no subpopulation estimated to contain more than 50 mature individuals,
OR
(ii) at least 90% of mature individuals in one subpopulation.
b. Extreme fluctuations in number of mature individuals.
D. Population size estimated to number fewer than 50 mature individuals.
E. Quantitative analysis showing the probability of extinction in the wild is at least 50% within 10 years or three generations, whichever is the longer (up to a maximum of 100% years).
The differences in the definitions between Critically Endangered, Endangered, and Vulnerable are largely related to the percentages in the above definitions; Endangered percentages are 50% and 70% and Vulnerable involves percentages of 10% and 30%. Species can be moved from one category to another if none of the relevant criteria has been met for a period of five years.
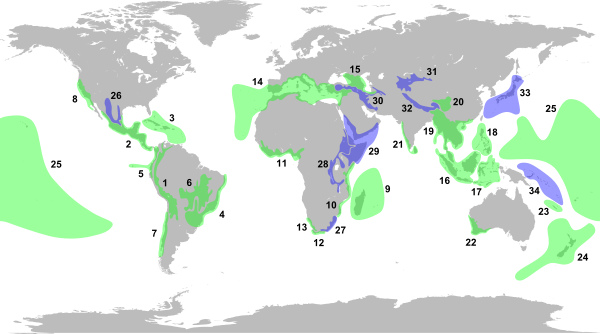
The other means of describing extinction risk is by defining extinction "hot spots" areas, where species are generally more threatened by human activities. A current map of hotspots is shown below. You can see that they are focused in the tropics and subtropics, as well as islands and mountains.
The rest of the module is devoted to telling the stories of species that have become extinct or are in the extinction crosshairs.