
The US Global Program on Climate Change defines a heat wave as, "a period of two or more consecutive days where the daily minimum apparent temperature (actual temperature adjusted for humidity) in a particular city exceeds the 85th percentile of historical July and August temperatures for that city". Heat waves have been more frequent and more intense in the last few decades. As the maps and graphs below illustrate, not only are heat waves getting more frequent, the seasons in which they occur are getting longer.
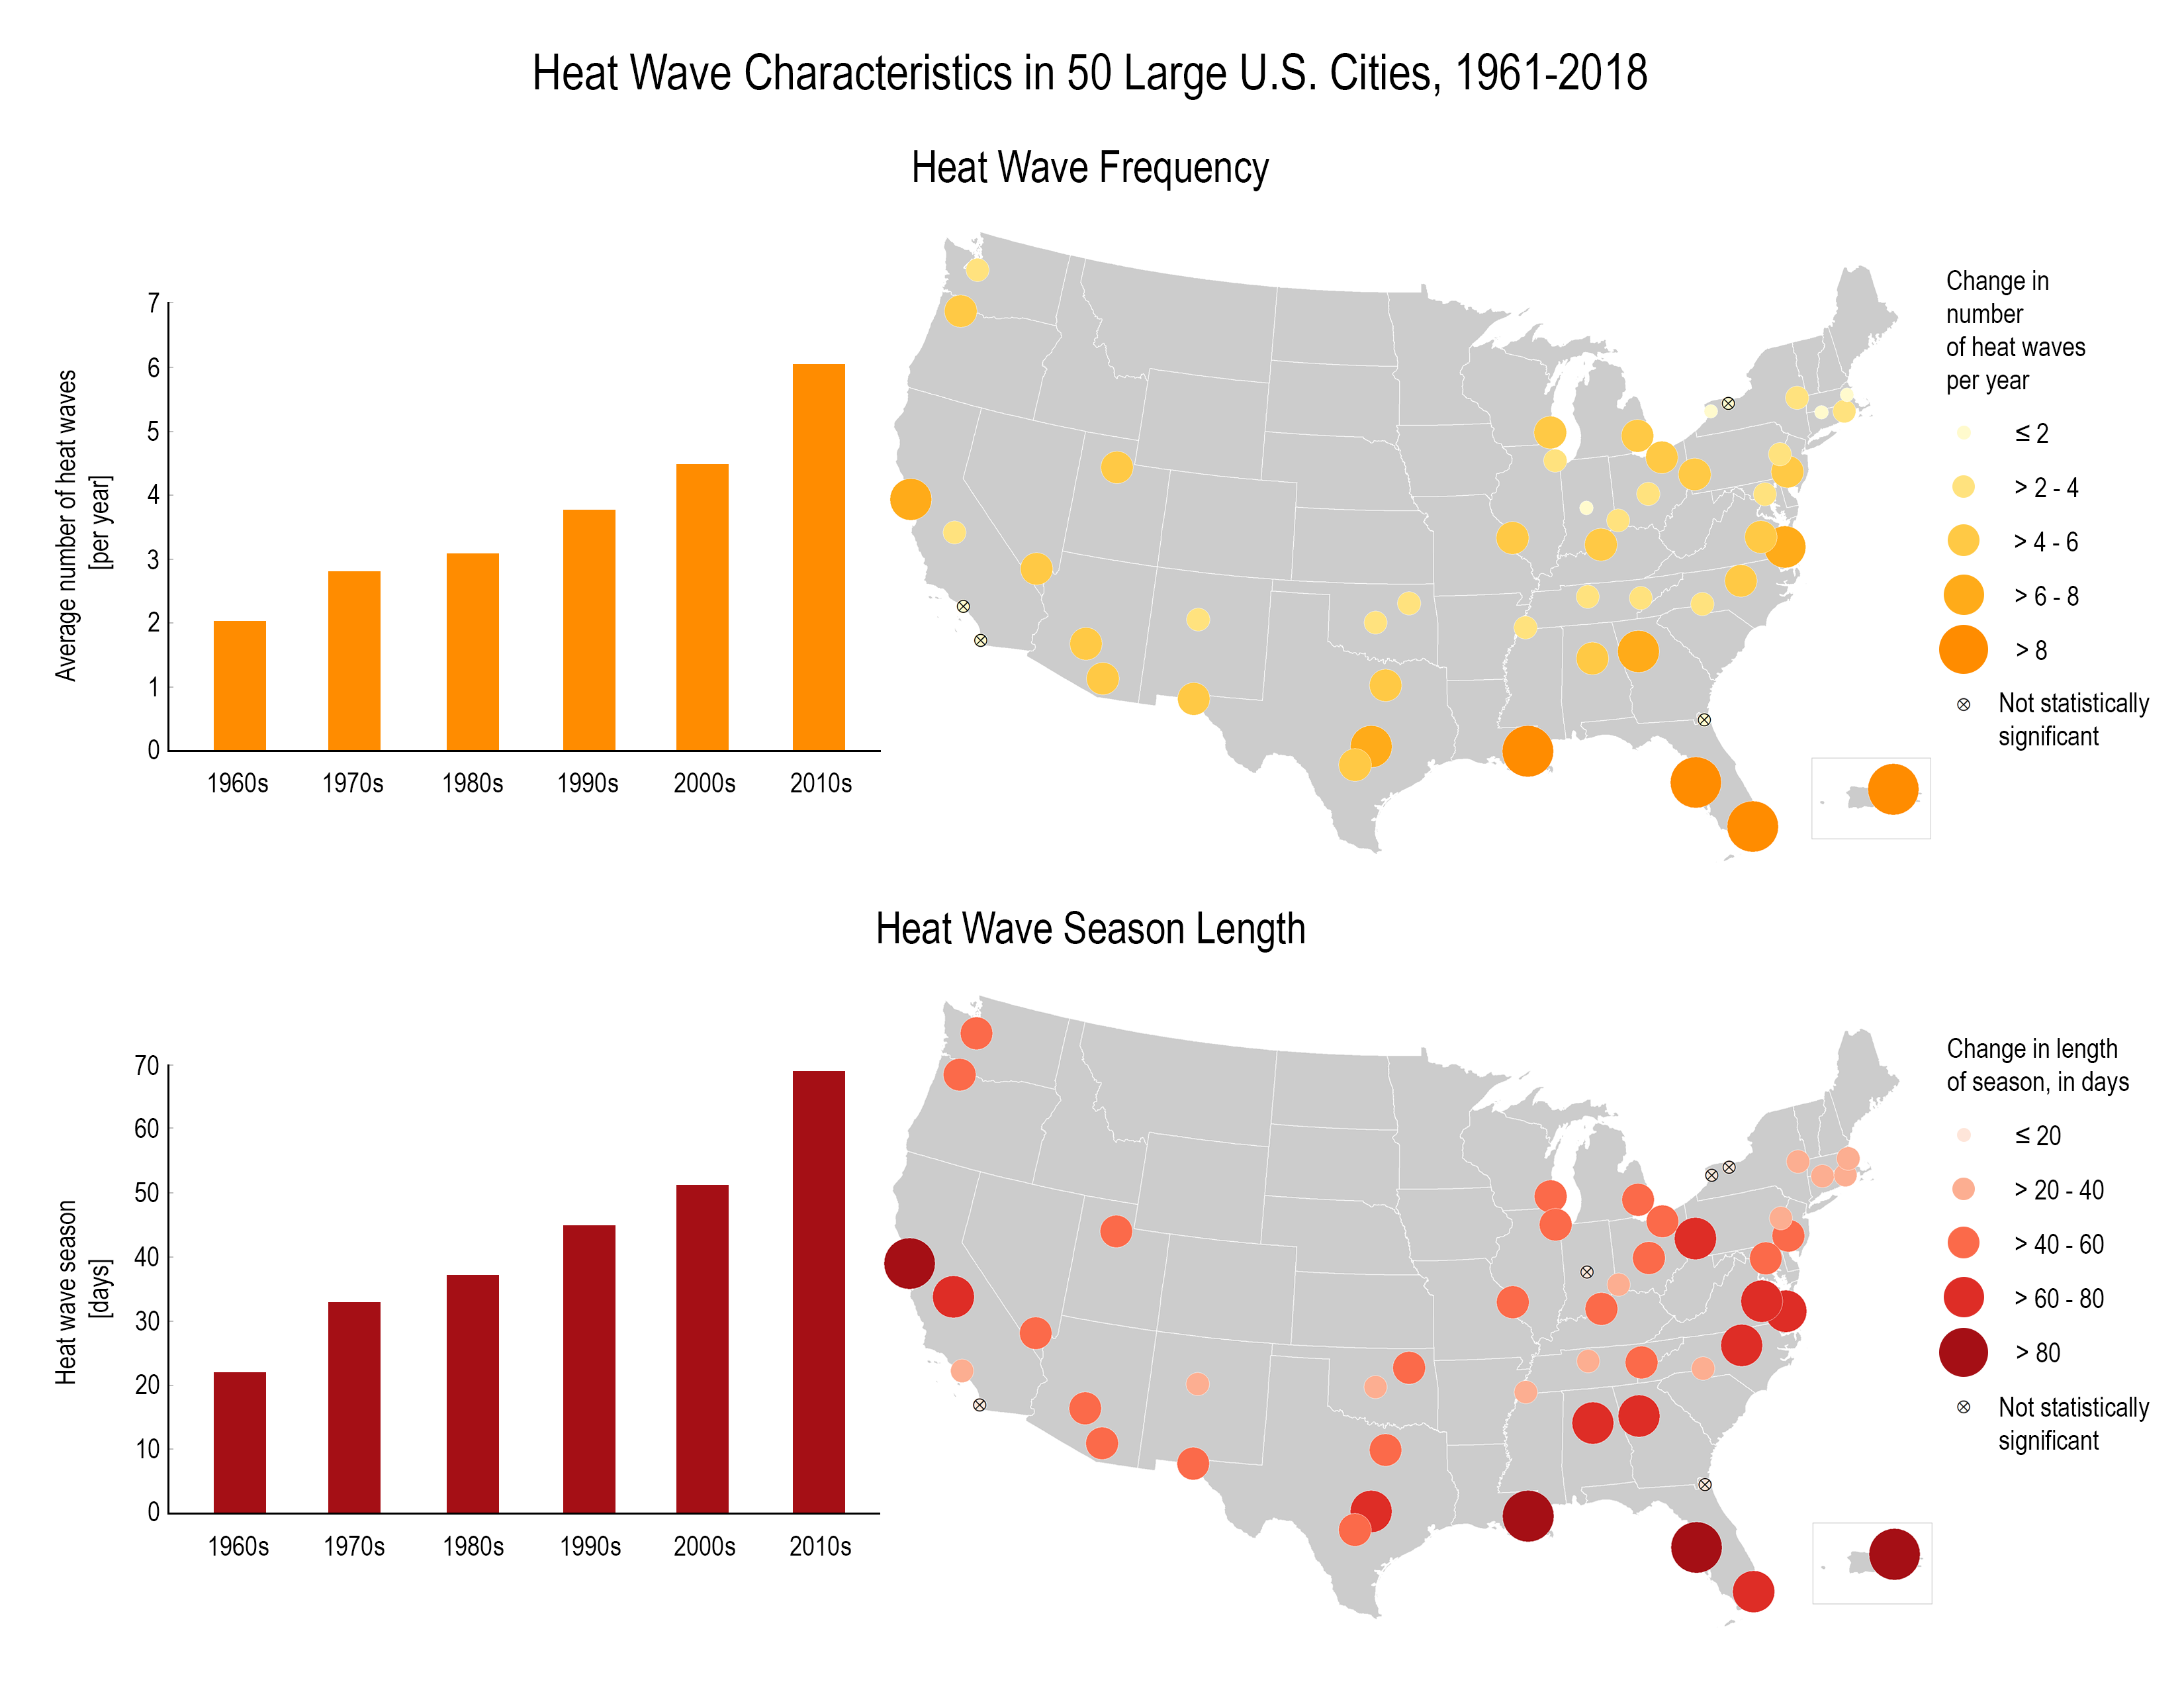
Heat Wave Characteristics in 50 Large U.S. Cities, 1961 – 2018. (Most of the cities are on the coast or the eastern half of the US.)
Heat Wave Frequency
Heat wave frequency has gone up from about 2 per year in the 1960s to 6 in the 2010s. Florida and Louisiana have seen the greatest increase of heat wave s per year.
Heat Wave Season Length
Heat wave season length has gone up almost everywhere especially in Florida, Louisiana, California, and Virginia. It has gone from roughly 20 days in the 1960s to 70 days in the 2010s.
But maybe when you look at these maps you think, "Ok, we're having more heat waves - that might be uncomfortable, but it's not actually affecting my health? Let's take a closer look. Remember in Lesson 3 when we were looking at vulnerability to climate change impacts and we talked about the 2003 heat wave in Europe and the almost 15,000 people in Paris who died (not to mention the 55,000 other people who died across Europe in that heat wave )?
Vulnerability plays a huge role in determining how a person or group of people experience climate change impacts. And yes, for many Americans, more heat waves are nothing more than an inconvenience. Perhaps I don't have air conditioning and will be uncomfortable. But maybe I have the resources (adaptive capacity) to minimize my exposure by staying with a family member with air conditioning, buying some fans, or spending the hottest parts of the day outside my home. My exposure might be similar to someone else's but as a healthy adult with reasonable resources, my sensitivity is lower and my adaptive capacity higher, thereby making me less vulnerable. While we saw that many of those deaths in Paris were elderly women, it's not just who you are that can make you vulnerable, but also what you do for a living. People who work outdoors have an obviously higher exposure to heat wave events and are therefore also more vulnerable to the direct health impacts those events bring (Xiang et al., 2014).
Let's take a look at a project in the Bronx to help identify residents most vulnerable to heat waves and the adaptation measures they're implementing to keep folks safe during extreme heat events.
DANNY PERALTA: I grew up here in New York City. This time of the year brings a lot of memories back-- the hydrants and smells and, I don't know, all of it. Yeah, yeah. It's a very distinct thing. Hunts Point in the Bronx is inclined to be much hotter than other neighborhoods, primarily because we're surrounded by highways.
24-hour, constant movement creates a lot of different pockets of heat in the neighborhood that you feel all the time. We have a lot of the more vulnerable populations-- folks that just got here from other countries, seniors that are not making any income. They can't maybe afford things like the fans and the ACs or the bill that comes with it.
[SIREN BLARING]
PRESENTER 1: Triple digits-- 103, the projected heat index in the city tomorrow.
PRESENTER 2: Three deaths are being blamed on the extreme heat that started--
CARI OLSON: People in New York City, New Yorkers who are at the greatest risk are getting sick and also dying because of the heat. We wanted to better understand how heat-related illness and death differed across New York City. Are all New Yorkers being impacted the same way? And the answer is that they're not. There are great inequalities. Jaime Madrigano at Columbia University, who was affiliated with CCRUN and NOAA, and researchers here at the health department started to look at how the distribution of heat-related illness and death differs across the city.
JAIME MADRIGANO: In cities, we have something called an urban heat island. The hot air gets trapped in the environment. And because of that, we see people dying of heat wave s every year. And areas of upper Manhattan and the Bronx are particularly heat-sensitive, vulnerable areas. I wanted to see the research that I did inform policy.
NOAA provided support and resources to get the project off the ground. We worked collaboratively with the New York City Department of Health and the New York City Mayor's Office over about a two-year period. Then it was published in 2015. The great thing about doing this study as part of CCRUN and working directly with stakeholders, such as the New York City Department of Health, is that they were able to take the results immediately, bring it up through their management, and direct it over to the New York City Mayor's Office so that it could be acted upon.
DANIELLA HENRY: The heat vulnerability study was the basis for the Cool Neighborhoods NYC Strategy.
BILL DE BLASIO: The city will be providing over 500 cooling centers. That's in city facilities and working with community-based organizations. There's over 500 locations around the city.
DANIELLA HENRY: Even though the city activates all of these cooling centers, individuals aren't going to them as much as we would want them to. We realized that it was really important to reach people within their homes, which was the impetus to create a program like Be A Buddy.
[KNOCKING]
PRESENTER 3: Hey, hey.
PRESENTER 4: What's going on, man?
PRESENTER 3: All right. How are you doing?
[MUSIC PLAYING]
DANNY PERALTA: Door knocking is very important. Having those folks strategically in the neighborhood that are getting to know the right people that are going to need support, that's huge.
PRESENTER 5: Fresh Meadows Library right here, See? That's a cooling center.
DANNY PERALTA: The Point is very excited about this opportunity to work with the Department of Health and the Office of the Mayor.
PRESENTER 6: So we're going to review what we just talked about.
DANNY PERALTA: For us, that means opening up this process for the community to come in and create part of that vision. If you don't give people a voice, they're not going to be an agent of change during these times.
CARI OLSON: We're really trying to think about how to empower the neighborhoods and give them the resources so that they can get to a place that's cool and stay safe.
DANNY PERALTA: If we have the tools, if we have the space to do this work, we can be our own citizen scientists, we can be our own first responders. And that's very, very key.
PRESENTER 7: --what it feels like to stand there with the [INAUDIBLE] on your tongue. Hear the gunshots or fire crackers on the 4 of July.
JAIME MADRIGANO: Heat waves are the biggest killer of all-weather events in the US. I knew that by working with CCRUN, the New York City Department of Health, and other stakeholders that are involved with CCRUN, my research would be used.
CARI OLSON: What we hope is that people can use this research to better understand heat health and also take action in their own communities.
DANIELLA HENRY: It's really important that all New Yorkers know how to stay safe and to know what are those protective measures that you can take and to really think about checking in on those that might really need it.
DANNY PERALTA: Whatever we do now has an impact 20, 50 years down the line. What do we want to see in 2020, 2025, 2035? We're laying the groundwork for that now.
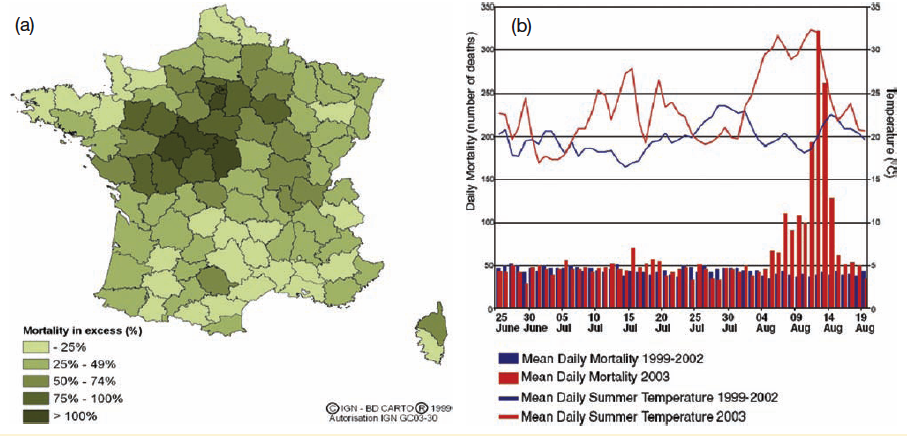
As heat wave frequency and intensity increase in a changing climate, heat wave mortality also rises. This map (a) and graph (b) from that 2003 European heat wave shows the increased mortality across France that summer (this is calculated based on the mortality you'd expect under normal conditions) as well as the mean daily temperature in 2003 and its corresponding daily mortality compared to those values for the 1999-2002 time period.
NOAA's Billion-Dollar Weather and Climate Disaster Database (yep, that's really a thing) includes four drought/heat wave incidents since 1980 in its list of deadliest events. It is interesting to note that heat wave mortality varies with location: in Russia, South Asia, and Southeast Asia, deaths were primarily in rural areas; in the US, deaths were almost exclusively in urban areas; and in southern Europe, deaths were in both rural and urban areas.