
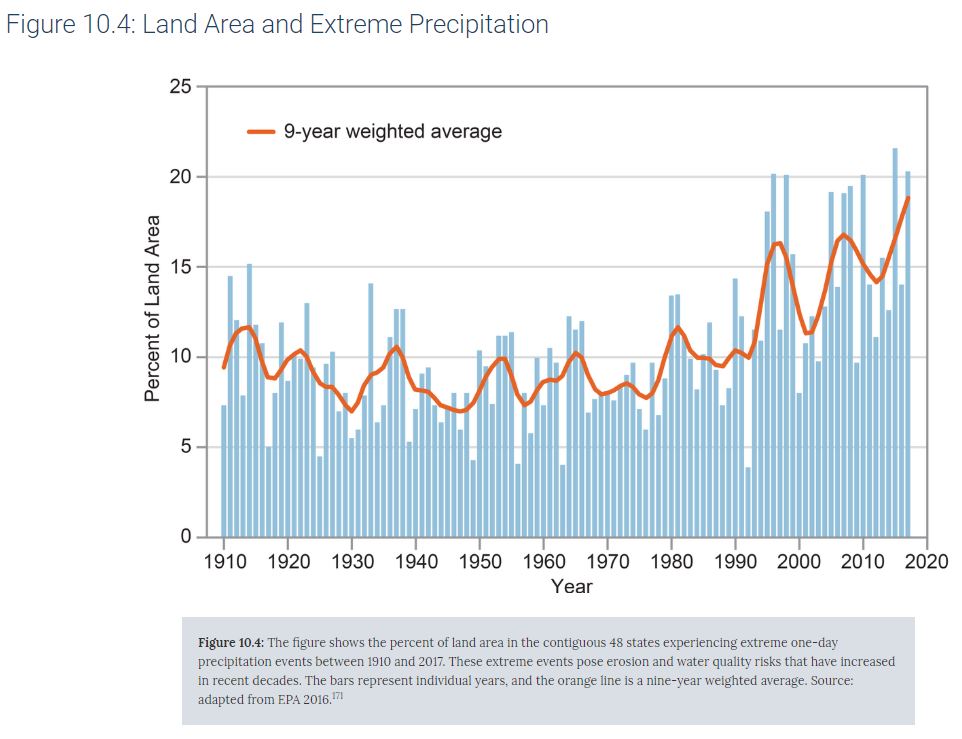
Extreme precipitation events, whether acute like the one day events described in the National Climate Assessment figure below or more chronic like the droughts illustrated on the US Global Research Program figure excerpted from the EPA, the consequences for food production can be widespread.
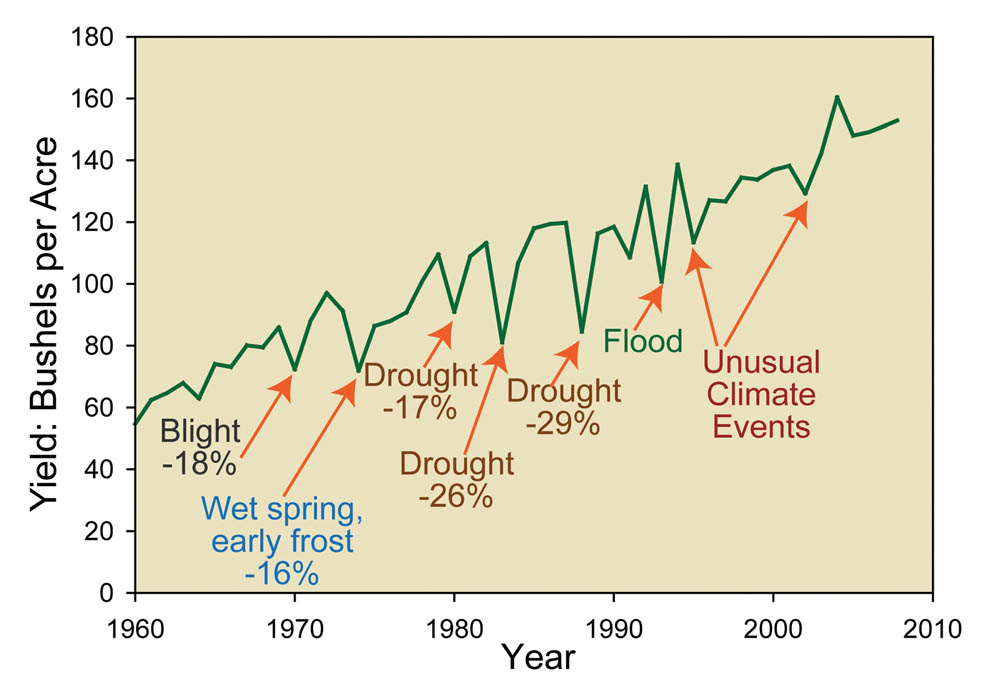
If we look at the 1960-2010 time frame here for US corn production, the first thing we notice is that yields have gone up rather steadily during this time. This is great, given what we've learned about the demands of our agricultural systems to feed 10 billion people worldwide by 2050. But as we look more closely, we can see that these yields are pretty sensitive to factors not easily within our control. Extreme precipitation events, drought, and other climatic incidents make farmers and their crops increasingly vulnerable to a changing climate.
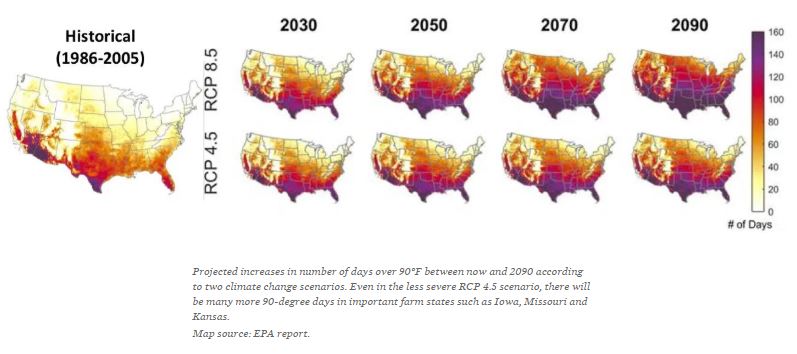
Now let's take a look at extreme temperatures. The bigger map to the left gives us the historical context of what we typically saw from 1986-2005 for days above 90 degrees Fahrenheit. Then, two of the IPCC's representative concentration pathways are utilized to predict what sort of change in the occurrence of those 90+ days we might expect to see. RCP 4.5 is a scenario that includes moderate action on climate change and atmospheric stabilization of CO2 by 2150. It's one of their middle-of-the-road scenarios. RCP 8.5, shown here across the top, is more of a worst-case scenario in which atmospheric concentrations continue to rise much longer because of delayed and inadequate mitigation efforts.
Extreme 1-day precipitation events in the continental US between 1910-2017
Credit: Fourth National Climate Assessment, Chapter 10 (2018) image originally from EPA (Fair Use)
Impacts of extreme precipitation on US corn yields 1960-2010
Credit: U.S. Corn Yields 1960 to 2008 from the US Global Change Research Program (Fair Use)
Projected Increases in Number of Days over 90F through 2090
Credit: EPA retrieve from Climate Change and Agriculture (2019) (Fair Use)