Prioritize...
By the end of this section, you should be able to discuss upwelling infrared radiation, and what controls its magnitude. You should also be able to complete an energy budget calculation as shown and assess whether temperature would increase, decrease or stay the same based on the result of the calculation.
Read...
Before we complete our radiation-based energy budget, let's quickly review some basics. It's the net gain or loss of radiation that determines whether temperature will increase or decrease, based on this calculation:
net gain or loss of radiation = downwelling radiation - upwelling radiation
So far, we've covered our important sources of downwelling radiation: downwelling solar and downwelling infrared (from atmospheric gases and clouds). So, we can rewrite our simple radiation-based energy budget like this:
net gain or loss of radiation = downwelling solar + downwelling IR - upwelling radiation
Now we just need to tackle that last piece of the puzzle--upwelling radiation. As it turns out, the main source of upwelling radiation that we need to consider is upwelling infrared radiation from the earth's surface. Let's explore.
Upwelling Infrared Radiation
You may have heard a weathercaster say something along the lines of "conditions are great for radiational cooling tonight." Often, if they try to explain that process, they'll say something like, "When the sun goes down, the Earth's surface begins to emit IR radiation to space." But, that's not quite right. Remember Planck's Law: all objects emit radiation at all wavelengths at all times. This means that the ground is always emitting infrared radiation, and the amount of upwelling IR from the ground depends on its temperature. For example, on a chilly winter morning you could expect an upwelling IR value below 300 Watts per square meter, while on a hot summer's day you might see values exceeding 500 Watts per square meter. To see an example, consider the "upwelling infrared" curve on the plot below from Penn State University March 11, 2012 (the same date as the plots on the previous page).
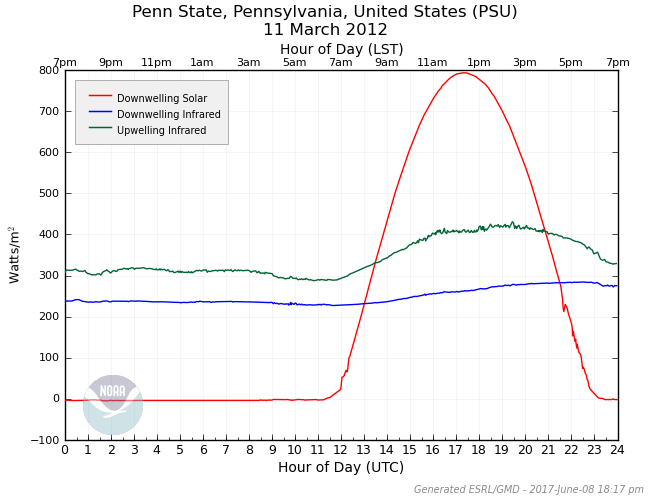
Remember that March 11, 2012 was a very sunny day at Penn State, and note that upwelling IR increases dramatically during the day as surface temperature rises, and then drops more slowly over the nighttime period as the surface temperature slowly cools. So, the ground actually tends to emit more IR radiation during the daytime, when the surface is hotter (and less at night, when the surface is cooler). In other words, any notion that the ground starts emitting IR radiation after the sun sets is nonsense.
Let's see how upwelling IR impacts our energy budget. Upwelling IR represents radiation leaving the surface of the Earth and therefore should be subtracted from our energy budget (much like expenses are subtracted from income in a household budget). Let's designate the surface's expense term: - upwelling IR.
The Complete Budget
If you combine the three terms of the surface energy budget, we get our final equation for the net gain or loss of radiation at the earth's surface:
net gain or loss of radiation = downwelling solar + downwelling IR - upwelling IR
This simple equation can be used to get a rough idea of the temperature trend of the surface. For example, using the graph above, look at the values of the three components at 1800Z. Downwelling solar is about 800 Watts per square meter, downwelling IR is about: 270 Watts per square meter, and upwelling IR is about 410 Watts per square meter. Insert those values into our calculation and we get:
net gain or loss of radiation = 800 W/m2 + 270 W/m2 - 410 W/m2
net gain of radiation = 660 Watts per square meter
Since this is a positive value, we have a net gain of radiation, and that means that temperature would be increasing at this time (the ground is warming because it's gaining energy overall). If we had a negative result, we would have a net loss of radiation, and the surface temperature would be decreasing (a final result of zero means there would be no net gain or loss, and temperature would remain the same).
Need another example? Take a look at the graph around 0600Z. That's nighttime at Penn State, so downwelling solar is 0 Watts per square meter. The downwelling IR is around 240 Watts per square meter and the upwelling IR is approximately 310 Watts per square meter. Using our budget equation, we have:
net gain or loss of radiation = 0 W/m2 + 240 W/m2 - 310 W/m2
net loss of radiation = -70 W/m2
Since the result is negative, we have a net loss of radiation, and that means temperature would be decreasing at this time (the ground is cooling because it's losing energy overall).
To see a couple more examples, watch this short video (4:47) I created, which summarizes energy budgets and walks through some energy budget calculations.
Click here for a transcript of this video video.
I've likened energy budgets to your bank account, and we'll use that idea to diagnose surface temperature trends. In banking, if you deposit more money in your account than you withdraw, your account balance will grow. But if you withdraw more than you deposit, your account balance will shrink.
Using radiation to construct an energy budget is similar. If an object absorbs more radiation than it emits, then its temperature will increase. It will warm up because more radiation is coming in than is going out. On the other hand, if an object absorbs less radiation than it emits, its temperature will decrease. It will cool because more radiation is going out than is coming in and being absorbed.
So to figure out if you have a net gain or loss of radiation, you take the difference between your incoming radiation and outgoing radiation. For the earth's surface we use this equation. We have downwelling solar and downwelling infrared as our sources of incoming absorbed radiation, and upwelling infrared radiation as outgoing emitted radiation. A positive result means a net gain in radiation and the earth's surface warms up. A negative result means a net loss of radiation, and the earth's surface cools.
Let's look at an example from Penn State University on May 8, 2017. To get our bearings on the graph, the red curve shows downwelling solar radiation, which is coming to the ground and being absorbed. The blue curve shows downwelling infrared radiation, which is radiation coming to the earth from clouds and air molecules in the atmosphere. The green curve shows upwelling infrared radiation, which is radiation that's being emitted from the earth.
To get a sense of what's going on here, let's start by looking at the solar curve. It's flat at zero watts per square meter until just after 10Z, which is 6:00 AM local time at Penn State on May 8, because Daylight Saving Time is in effect. After sunrise around that time, the amount of downwelling solar increases. And the curve is mostly smooth except for a few wiggles, which is telling us that skies were mostly clear.
Then after 17Z, the solar curve jumps around quite a bit, and there are some really big decreases because of clouds scattering some incoming solar radiation back to space. We also see some small upward bumps in the downwelling infrared curve, because the clouds were emitting some additional IR radiation to the ground, too.
So what if we want to calculate a net gain or loss of radiation at local noon? That's 16Z on May 8 at Penn State. And we just have to read our values off the graph and plug them into our equation.
It looks like incoming solar would be about 1,000 watts per square meter at 16Z, and we just have to plug that into our equation. Downwelling infrared radiation looks to be about 250 watts per square meter. So those are our two sources of incoming radiation at the surface.
Our upwelling infrared is our emitted radiation, marked by the green curve. And it would be about 400 watts per square meter. So we have to subtract 400 in our equation.
Crunch the numbers and we end up with a positive result of 850 watts per square meter. The ground was warming up at local noon because we had a net gain in radiation at that time. More radiation was coming in and being absorbed than was being emitted. In reality other factors impact temperature, too, but we're going to ignore those for now and just focus on the impacts of radiation on temperature trends.
If we wanted to do a calculation at nighttime, we could do that too. Let's do one before dawn at 9Z. That's 5:00 AM local time at Penn State on May 8. Note the little bump up in downwelling infrared at this time, suggesting some cloudiness. Again, we just have to read the values off the graph and put them into our equation.
There's obviously no contributions from the sun at 9Z because it's before the sun comes up. So downwelling solar is zero watts per square meter. Downwelling infrared is about 300 watts per square meter, and upwelling infrared is about 320 watts per square meter. So we take 300 and we subtract 320. And we get a result of negative 20 watts per square meter. That's a small negative result. And the ground would be cooling very slightly, since we have a small net loss of radiation. A little more radiation is leaving than is coming in and being absorbed.
So clouds acting as space heaters at this time were able to boost downwelling infrared radiation almost enough to erase the radiation deficit and nearly stop the nighttime decrease in temperature at this time.
Of course, radiation isn't the only way that energy flows through the earth-atmosphere system, and it's certainly not the only controller of temperature. If only forecasting temperature was as easy as making a simple radiation-based energy budget! Still, weather forecasters must consider the local energy budget when thinking about temperature trends because it's an important piece of the puzzle. We'll start expanding our knowledge of other types of energy transfer and impacts on temperature soon, but up next we're going to apply your new knowledge about energy budgets to the "greenhouse effect" and global warming. Before you move on, however, check out the Quiz Yourself section below, which will allow you to test your understanding of energy budgets and the resulting impacts on temperature.
Quiz Yourself...
The interactive calculator below will give you some more practice thinking about surface temperature trends based on a given energy budget (which you can adjust). To orient yourself, the surface temperature slider on the left controls the upwelling IR component, while the day/night toggle at the top controls the downwelling solar component. If you want to complicate the problem, add high or low clouds by clicking their respective check boxes. After you select a scenario, try to figure out the heating or cooling trend at the surface. Check your reasoning by placing your mouse over the budget panel on the right. You might also compare similar scenarios (for example, look at the nighttime temperature trend with a low cloud versus no cloud).