Prioritize...
By the end of this section, you should be able to discuss the concept of an energy budget and its impacts for temperature. You should also be able to discuss downwelling radiation and its sources. Finally, you should be able to infer sky coverage (clear versus cloudy) and basic events from radiation plots (such as sunrise / sunset times, and major changes in sky coverage).
Read...

You learned early on in this course that temperature is a measure of the motion (or vibration) of molecules within a substance. The fact that the molecules are moving means that temperature must be a measure of energy -- often referred to as "thermal energy" (or "heat energy"). Therefore, understanding the temperature change at a particular location is simply a matter of identifying all of the ways that energy enters, leaves, changes form or is transferred at that location.
To begin this process, let's begin with identifying how energy enters or leaves a location via radiation. Returning to our checking-account analogy from earlier in the lesson, deposits increase the amount of money in your account, while withdrawals decrease the amount of money in your account. The difference between the two determines whether the balance in your account grows or shrinks in value. You can think of the earth's energy "account balance" as its surface temperature. If more radiation is coming in than leaving, the surface will heat up (temperature will increase); if more radiation is leaving than coming in, then the surface will cool (temperature will decrease).
But, how do we know whether we have a net gain or loss of radiation? Well, every financial planner will tell you that you need to make a budget so that you can see exactly what money is coming in and what you are spending so that you know if your bank account is growing or shrinking over time. Likewise, we can make an energy budget in order to keep track of the radiation that is being absorbed and emitted by a surface. For our budget, we treat all downwelling radiation (radiation traveling downward toward the surface) as income (that is, a positive contribution), and upwelling radiation (radiation traveling upward, away from the surface) as an expense. So, our energy budget based on radiation boils down to this simple equation:
net gain or loss of radiation = downwelling radiation - upwelling radiation
By examining the net gain or loss of radiation, we can determine if temperature will increase or decrease. To get started, let's look at the earth's radiation "income" -- downwelling radiation.
Downwelling Solar Radiation
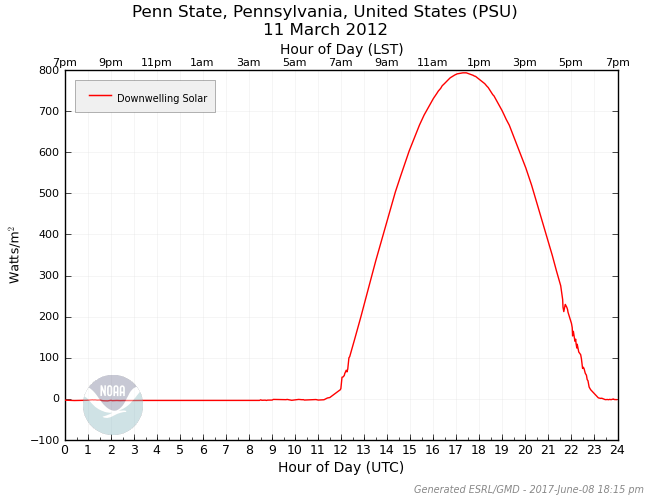
If I asked you to name a source of downwelling radiation for the earth, my guess is many would immediately answer "the sun." That's a good answer! The sun is obviously a major source of downwelling radiation for the earth (during the daylight hours, of course). Remember that the sun's peak emission lies in the visible spectrum, which is convenient for us on Earth because the atmosphere is largely transparent to visible light. Therefore, most of the energy received at the Earth's surface is in the visible spectrum. So, how much radiation does the Earth's surface receive from the sun? Check out the plot below showing the 24-hour plot of the power (energy per unit time) per unit area from downwelling solar radiation at Penn State University on March 11, 2012. At its peak on this date (between 17Z and 18Z), downwelling solar radiation was almost 800 Watts per square meter, so it's as if eight 100-Watt light bulbs were shining on each square meter of the earth.

The first thing that you should notice about the shape of the graph is that the sun contributes radiation for only a portion of the 24-hour day (the daytime, obviously). Next, notice that the shape of the radiation curve looks like the top half of a wave. This results from the fact that the heating power of the sun depends on the angle of incoming sunlight. You encounter this concept anytime you shine a flashlight against a surface and change the angle; check out these side-by-side photos of a flashlight shining on a wall at different angles (credit: David Babb) for a visual depiction. When the sun is low in the sky (just after sunrise and before sunset), a lower sun angle results in less heating power per unit area. The sun's heating power per unit area peaks when the sun is highest in the sky (toward the middle of the day). I should also point out that the time of year can dramatically change this curve as well. For example, compare similar plots for downwelling solar on December 11, 2011 and June 2, 2011. The sun's heating power per unit area is greater in the summer, which probably doesn't surprise you.
But, the curves for downwelling solar radiation aren't always as nice and smooth as the one above. To see what I mean, check out this downwelling solar plot for March 18, 2012. Why the jagged appearance in the plot? If you answered "clouds," then you're spot-on! Clouds can block varying degrees of downwelling solar radiation, depending on sky coverage and the thickness of the clouds. On a completely overcast day, for example, peak values of downwelling solar are much lower (note that the peak was only around 270 Watts per square meter on this very cloudy day), because of clouds scattering a significant amount of incoming solar radiation back to space.
So how do we enter this "income" on our energy budget balance sheet? Just like you don't get to keep all of the income you make, technically the surface isn't allowed to keep all of the radiation that strikes it, either. Remember that Earth's albedo is about 30 percent, meaning that about 30 percent of incoming solar radiation is reflected back to space. But, that's an average value. The amount of the sun's visible light that is absorbed by the surface and converted to heat energy depends on surface albedo at any given location, and dark surfaces (asphalt, forests, etc.) will have lower albedos than brighter surfaces. To avoid that complexity, we're going to ignore albedo in our calculations, so we'll just use the raw value of downwelling solar as the amount of solar radiation being absorbed by the surface. We'll refer to the contributions from downwelling solar as + downwelling solar (the "+" here indicates a positive contribution to our energy budget).
Downwelling solar, however, isn't the only source of incoming radiation. Indeed, downwelling infrared radiation is also a major source of radiation absorbed by the surface of the earth.
Downwelling Infrared Radiation
Did you know that the amount of infrared radiation the earth receives from the atmosphere over a 24-hour period is, on average, comparable to (if not greater than) the incoming solar radiation during the day? Pretty amazing! Keep in mind that, even though the sun is way, way hotter, it occupies much less of the sky than our atmosphere. Moreover, the atmosphere emits infrared radiation all day and all night (instead of just during the daytime, like the sun). And like the persistent tortoise, slow and steady often wins the race in terms of radiation.
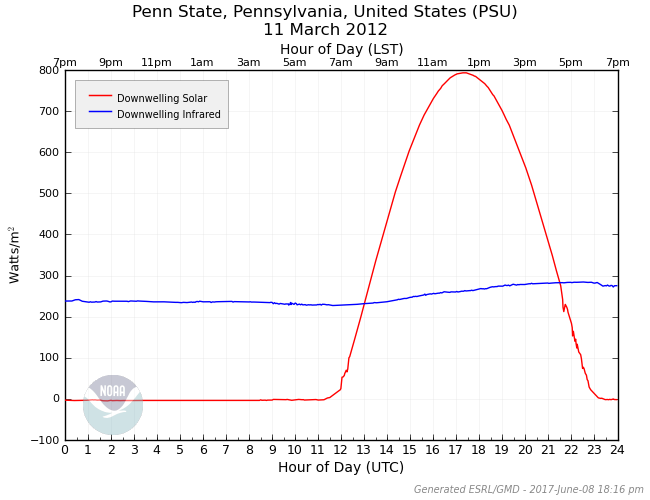
To see what I mean, examine the radiation plot below. This is the same plot as above (March 11, 2012 at Penn State), only with downwelling infrared (IR) added. Notice that the downwelling IR radiation is, on average, around 250 Watts per square meter and doesn't change much throughout the day. To understand where this radiation comes from, remember that all matter emits radiation at all wavelengths at all times (Planck's Law). In addition, the atmosphere is a fairly efficient absorber of IR radiation due to atmospheric gases such as water vapor and carbon dioxide. In turn, these gases emit IR radiation as well as they absorb it (Kirchoff's Law), and thus, some of this emitted radiation makes it down to the surface. If I add up the total contribution to the downwelling IR radiation, I get a value of approximately 6,000 Watt-hours per square meter for a whole 24-hour period. Likewise, if I add up the total solar contribution, the value comes out to be around 6,100 Watt-hours per meter squared. Pretty surprising, eh?

This graph came from a nearly perfectly sunny day, so the downwelling IR is mainly from invisible air molecules. But, what about clouds? Do they affect downwelling IR? Indeed they do! However, instead of limiting downwelling radiation (as they do for solar radiation), they actually increase downwelling IR radiation. And, the warmer the clouds are, the more IR radiation they emit. In this light, think of clouds as "space heaters," emitting energy toward the ground. For this reason, a cloudy night will tend to be much warmer than a clear night (all else being equal).
To prove my point using actual data, check out this plot on March 12, 2012. Notice that the solar component contains the signature of increasing clouds (some abrupt drops in downwelling solar late in the day). Likewise, note that the downwelling IR component increases from a low of 250 Watts per square meter in clear sky (around sunrise) to nearly 400 Watts per square meter (later in the day, after 20Z). It turns out that these were pretty warm clouds, and we'll learn later that warmer clouds reside lower in the atmosphere. For another example, examine this plot from March 10, 2012. It is indeed mostly clear throughout the daylight hours, but what about the night before? Just look at the elevated values of downwelling IR from 02Z to 10Z. The elevated values of downwelling IR tell you that clouds were present, and the somewhat "bumpy" appearance in the downwelling IR plot overnight suggests some changes in the cloud cover during that period.
Since downwelling IR is a second source of income for the surface, we need to add it to downwelling solar. Let's designate the surface's IR income as + downwelling IR. That covers the major sources of radiation "income" for the surface. Up next, we'll turn our attention to the surface's radiation "spending habits" (emissions of radiation) and complete the picture of our energy budget.