Prioritize...
After you've completed this section, you should be able to discuss temperature advection and its proper units, discuss its impacts on temperature trends, and perform simple temperature predictions based on a given temperature and value of temperature advection.
Read...
We just learned about temperature trends that occur with the passage of cold and warm fronts, and now it's time to look at how those temperature trends occur. For starters, let's think really big-picture for a moment. Over polar regions in the winter hemisphere, where the sun doesn't rise above the horizon for months on end, very cold cA air masses form, and temperatures can occasionally plummet to minus 60 degrees Fahrenheit or lower! Meanwhile, over low latitudes, where sunshine remains relatively intense, daytime temperatures frequently reach the 80s or higher. The contrast between cold air at higher latitudes and warmer air at lower latitudes results in the existence of fronts (boundaries between air masses).
If air masses never moved, polar regions would get progressively colder and low latitudes would grow increasingly warmer, but the atmosphere tries to run a tidy ship, tirelessly working to smooth out large horizontal contrasts in temperature. How is this possible? Well, air masses move, and the wind carries cold air southward and warm air northward in an attempt to moderate the large north-south temperature contrasts. Meteorologists describe the horizontal movement of cold and warm air by the wind as temperature advection (the word "advection" loosely translates to "transport"). Specifically, cold-air advection (sometimes abbreviated "CAA") describes the horizontal transport of cold air by the wind, and warm-air advection (abbreviated "WAA") represents the horizontal transport of warm air by the wind.
Acting alone, warm-air advection causes local temperatures to increase with time, and is the primary cause of temperature increases associated with warm frontal passages. Meanwhile, acting alone, cold-air advection causes local temperatures to decrease with time, and it's the primary cause of temperature decreases behind cold frontal passages. Temperature advection is measured as a change in temperature per unit time, and the common units of temperature advection are degrees Fahrenheit per hour, with positive values indicating warm-air advection and negative values representing cold-air advection. To figure out the total change in temperature due to advection (in degrees F, for example), simply multiply the advection (degrees F per hour) by the time duration (hours).
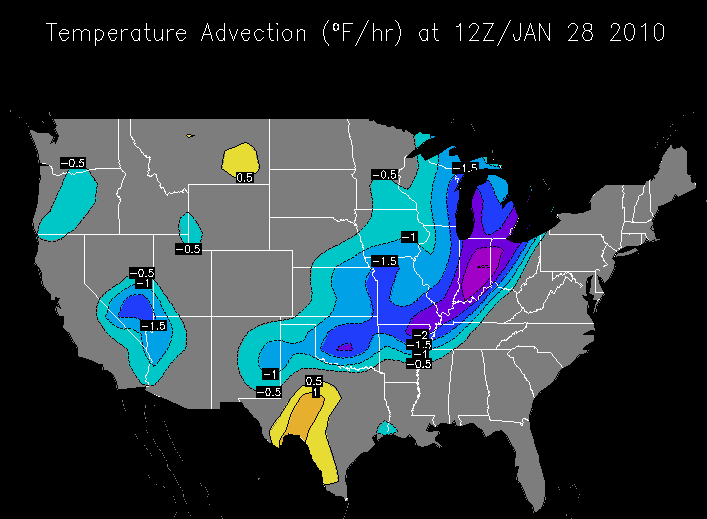
For example, check out the contour map of temperature advection above from 12Z on January 28, 2010, and imagine you're located near Cincinnati, Ohio (located on the -2 degrees Fahrenheit per hour temperature advection contour). If the 12Z temperature at Cincinnati was 30 degrees Fahrenheit, and temperature advection remained constant and was the only factor impacting temperature, what would the temperature be two hours later at 14Z? Well, if the temperature advection remains at -2 degrees Fahrenheit per hour, temperature will drop by 4 degrees Fahrenheit in two hours (-2 degrees Fahrenheit per hour multiplied by 2 hours). Subtract 4 degrees Fahrenheit from 30 degrees Fahrenheit (the 12Z temperature), and you get 26 degrees Fahrenheit. Pretty simple, right?
Granted, temperature forecasting is not really that simple. In our calculation, we assumed that temperature advection was the only factor controlling temperature, but as you already know, many factors can affect the temperature change at a particular location (such as the energy budget). Advection is only one temperature controller, so don't be surprised in reality if the observed temperature trend doesn't match up with the temperature trend from advection alone.
In many cases, the magnitude of surface temperature advection is 5 degrees Fahrenheit per hour or less, with larger values of cold-air advection sometimes observed during the throes of winter. Note in the image above that values of cold-air advection (blues and purples on the image below) reached minus 2.5 degrees Fahrenheit per hour in Indiana and western Ohio, with a very small pocket of minus 3 degrees Fahrenheit per hour over east-central Indiana. This broad area of cold-air advection was a result of northwesterly winds transporting cold air southeastward behind a cold front.
Lest I leave you with the impression that warm-air advection is inconsequential, keep in mind that profound warm-ups during winter over the northern tier of the nation typically result from strong warm advection. On the above image, warm advection wasn't particularly strong, however, with the strongest areas located over southwest Texas. Near the Big Bend in the Rio Grande River Valley, warm-air advection was greater than 1 degree Fahrenheit per hour, but less than 1.5 degrees Fahrenheit per hour.
Handy analyses of temperature advection aren't always available, so meteorologists are always looking at patterns of temperature and winds to get a handle on temperature advection. Take for example, the computer model forecast for temperatures and winds at an altitude of roughly 5,000 feet, valid at 21Z on March 8, 2016 (below). I've circled an area where winds were clearly predicted to blow from a region of colder air (indicated by blue shadings) toward a region of warmer air (green and yellow shadings), signifying cold advection. The impact of the cold advection (colder air surging southward) is evident in the temperature pattern, too.
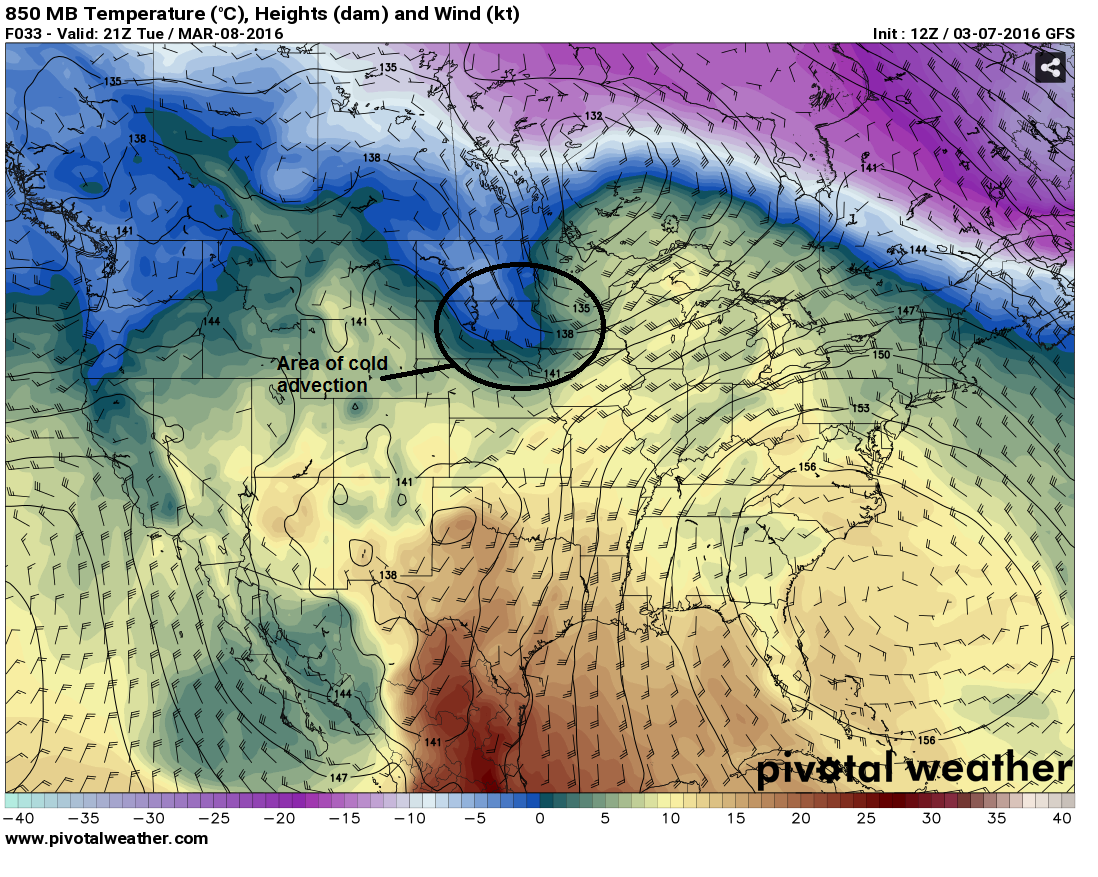
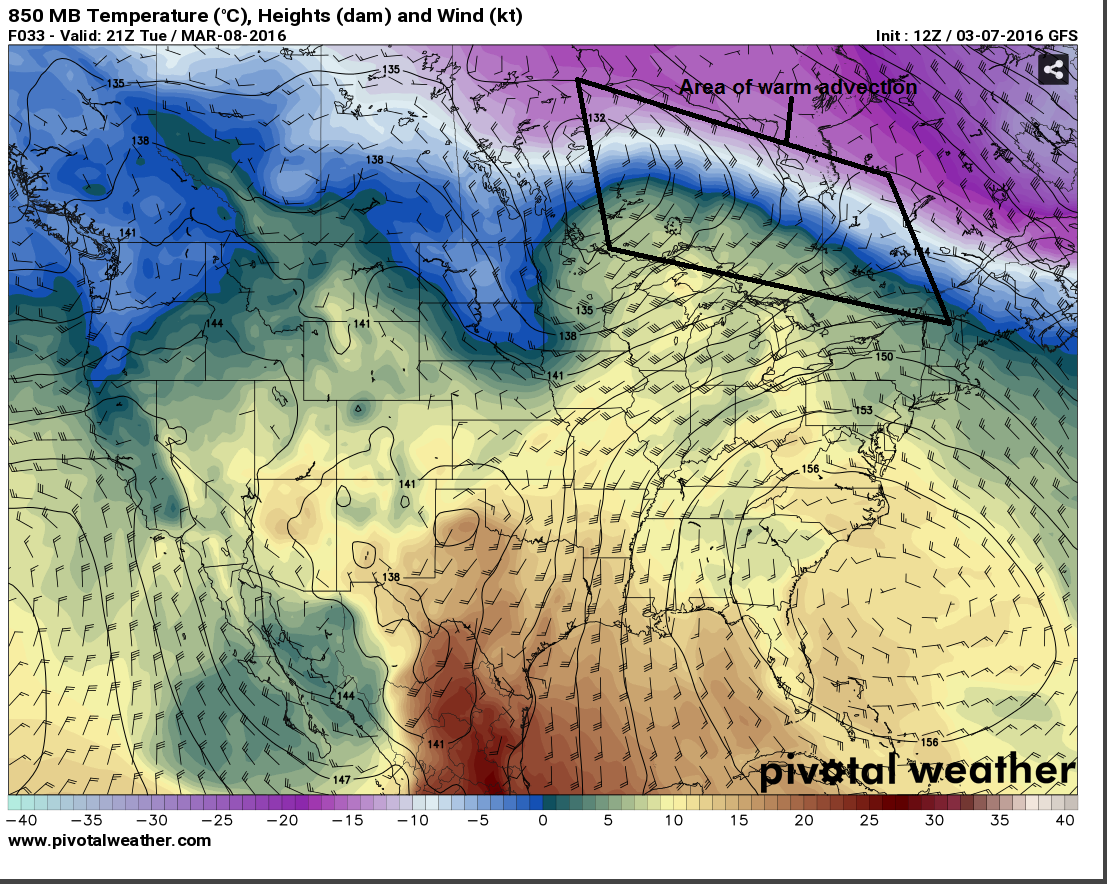
Note that other, unlabeled areas of temperature advection also exist on the map: Can you see an area of warm advection occurring north of the Great Lakes where winds were predicted to blow from warmer air toward colder air? Weather forecasters couldn't have used such a map by itself to make specific temperature predictions, because temperature advection is only one factor that controls temperature. Still, when weather forecasters identify areas of warm and cold advection, they factor them into their temperature forecasts.
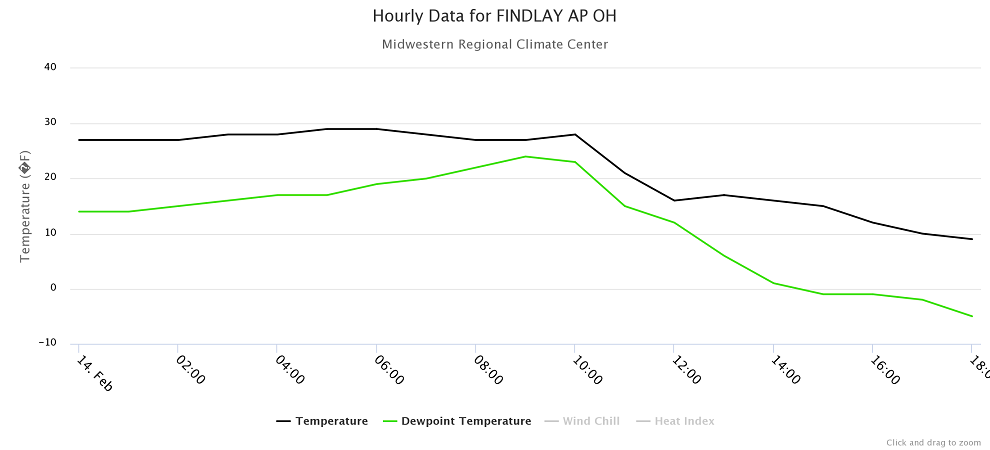
In fact, in the winter hemisphere, temperature advection can be the dominant temperature controller because low sun angles reduce the power of solar heating. Have you ever experienced a day when temperatures actually declined throughout the entire afternoon? Strong cold advection behind a cold front was likely a culprit, as it can overwhelm weak solar heating in the winter and cause temperatures to decrease during the daytime (recall our example from Findlay, Ohio when temperatures began falling at 10 A.M. local time when a cold front passed). On the other hand, on winter nights, strong warm advection can actually cause temperatures to increase through the night, and sometimes daily maximum temperatures occur overnight, while it's dark out. Ah, the power of advection!
In the summer hemisphere, temperature advection is typically weaker, and has much stiffer competition from solar heating because higher sun angles provide more intense solar radiation. So, in the summer, cold advection can easily be overwhelmed by the strength of solar heating during the day, and temperatures can actually rise while cold advection is occurring behind cold fronts, for example (this is often true in the late spring and early autumn, too).
Finally, I should point out that the wind doesn't always produce temperature advection. Temperature advection would be "neutral" if winds transport air with equal temperature. Even in such cases, winds can still impact temperatures via mixing of mechanical eddies, as you know. So, there's no doubt that the wind can play a big role in determining day-to-day temperature changes. What other factors impact temperatures over short periods of time (during the course of a day)? We'll explore more in the next section! But, before you move on, try out the practice problems in the Key Skill box below.
Key Skill...
A key skill in this section is to make a temperature prediction based on an initial temperature and a value of temperature advection (assuming advection is the only factor impacting temperature).
Ready for some practice?
Example #1:
Assume that particular location has a current temperature of 45 degrees Fahrenheit and is experiencing a temperature advection of -3 degrees Fahrenheit per hour. If no other factors affect the local temperature, and the value of temperature advection doesn't change, what will the temperature be in two hours?
Answer: The temperature in two hours will be 39 degrees Fahrenheit. Temperature advection of -3 degrees Fahrenheit per hour for 2 hours results in a temperature change of -6 degrees Fahrenheit (-3 degrees Fahrenheit per hour multiplied by 2 hours). 45 degrees Fahrenheit - 6 degrees Fahrenheit = 39 degrees Fahrenheit.
Example #2:
Assume that particular location has a current temperature of 60 degrees Fahrenheit and is experiencing a temperature advection of 2 degrees Fahrenheit per hour. If no other factors affect the local temperature, and the value of temperature advection doesn't change, what will the temperature be in four hours?
Answer: The temperature in four hours will be 68 degrees Fahrenheit. Temperature advection of 2 degrees Fahrenheit per hour for 4 hours results in a temperature change of 8 degrees Fahrenheit (2 degrees Fahrenheit per hour multiplied by 4 hours). 60 degrees Fahrenheit + 8 degrees Fahrenheit = 68 degrees Fahrenheit.