Prioritize...
At the completion of this section, you should be able to describe how a satellite constructs an image in the visible spectrum, and describe how to discern the relative thickness of various clouds types on visible satellite imagery. In particular, you should be able to describe how very thick clouds (such as cumulonimbus) appear compared to very thin clouds (like cirrus).
Read...
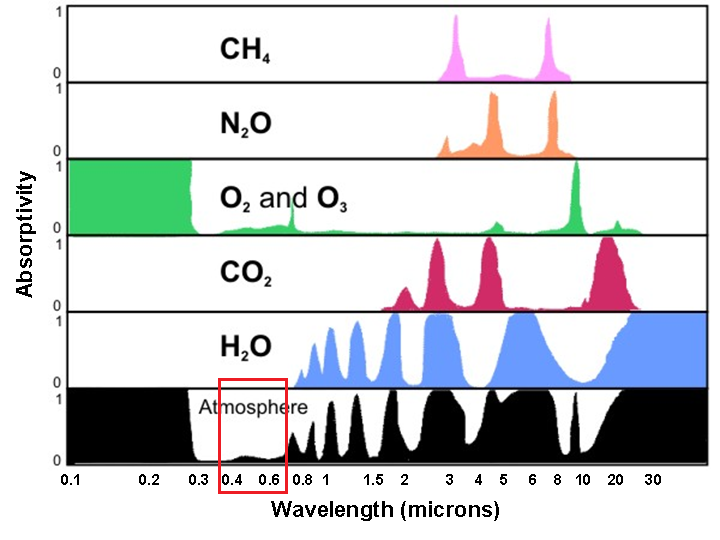
Perhaps you've heard a television weathercaster use the phrase "visible satellite image" before. Perhaps you also thought, "Of course it's visible if I can see it!" So, why make the distinction that a satellite image is "visible?" In short, visible satellite images make use of the visible portion of the electromagnetic spectrum. If you recall the absorptivity graphic that we used back when we studied radiation, notice that from a little less than 0.4 microns to about 0.7 microns, there's very little absorption of radiation at these wavelengths by the atmosphere. In other words, the atmosphere transmits most of the sun's visible light all the way to the Earth's surface.
Along the way, of course, clouds can reflect (scatter) some of the visible light back toward space. Moreover, in cloudless regions, where transmitted sunlight reaches the earth's surface, land, oceans, deserts, glaciers, etc. unequally reflect some of that visible light back toward space (with little absorption along the way). You might say that visible light generally gets a free pass while it travels through the atmosphere.
An instrument on the satellite, called an imaging radiometer, passively measures the intensity (brightness) of the visible light scattered back to the satellite. I should note that, unlike our eyes, or even a standard camera, this radiometer is tuned to measure only very small wavelength intervals (called "bands"). The shading of clouds, the earth's surface (in cloudless areas) and other features, such as smoke from a large forest fire or the plume of an erupting volcano, all can be see on a visible satellite image because of the sunlight they reflect.
What determines the brightness of the visible light reflected back to the satellite and thus the shading of objects on a visible satellite image? Well to start with, we need to have a some source of light. To see what I mean, check out this visible satellite loop of the United States spanning from 0815Z to 1945Z on September 29, 2017. The image is completely dark at the beginning because 0815Z is the middle of the night in the United States, but gradually we start to see clouds appear on the image from east to west as the sun rose and the reflected sunlight reached the satellite. The bottom line is that standard visible satellite imagery is only useful during the local daytime because we are measuring the amount of sunlight being reflected from clouds and the surface. If there's no sunlight, there's no image.
Now, assuming that it's during the day, the brightness of the visible light reflected by an object back to the satellite largely depends on the object's albedo, which as you may recall is simply the percentage of light striking an object which gets reflected. Since the nature of Earth's surface varies from place to place (paved streets, forests, farm fields, water, etc.), the surface's albedo varies from place to place.
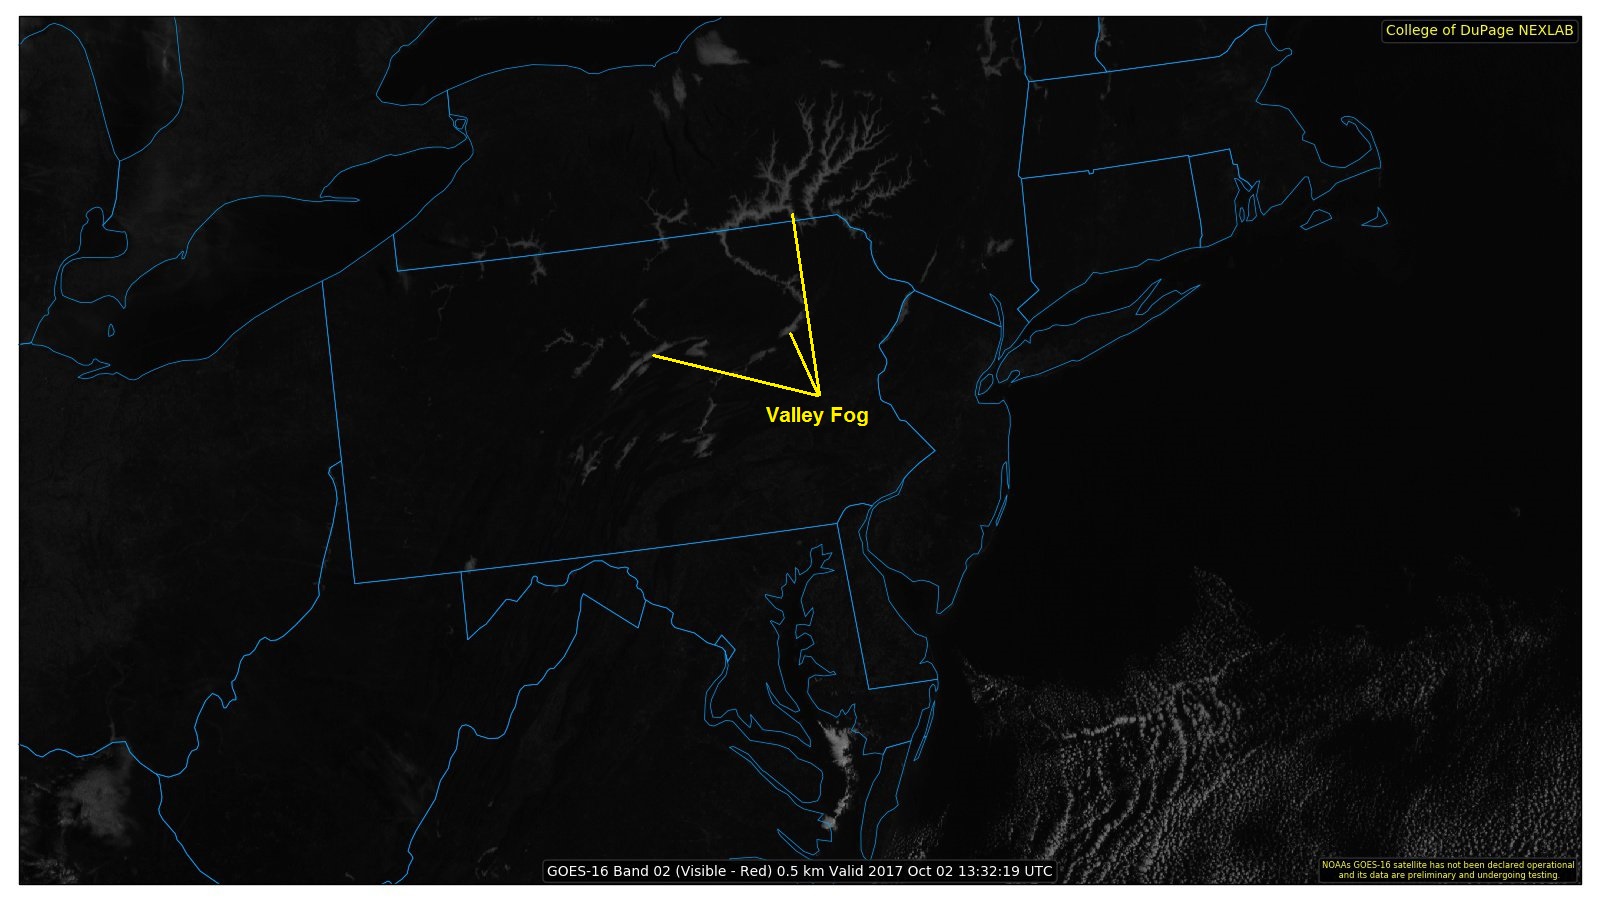
For example, take a look at the visible satellite image showing Pennsylvania and surrounding states around 18Z on October 2, 2017 (below). For the full effect, I recommend opening the full-sized version of the image for a better look. This particular day was nearly cloudless over Pennsylvania, so it gives us a great opportunity to really see how albedo makes a difference in the appearance of an object on visible satellite imagery. The surface in Pennsylvania hardly looks uniform, and that's a result of differing albedos associated with different surfaces. For example, bare soil reflects back about 35 percent of the visible light that strikes it. Vegetation has an albedo around 15 percent. By the way, bodies of water, with a representative albedo of only 8 percent, typically appear darkest on visible satellite images. See how the labeled bodies of water all look darker than the land surfaces?
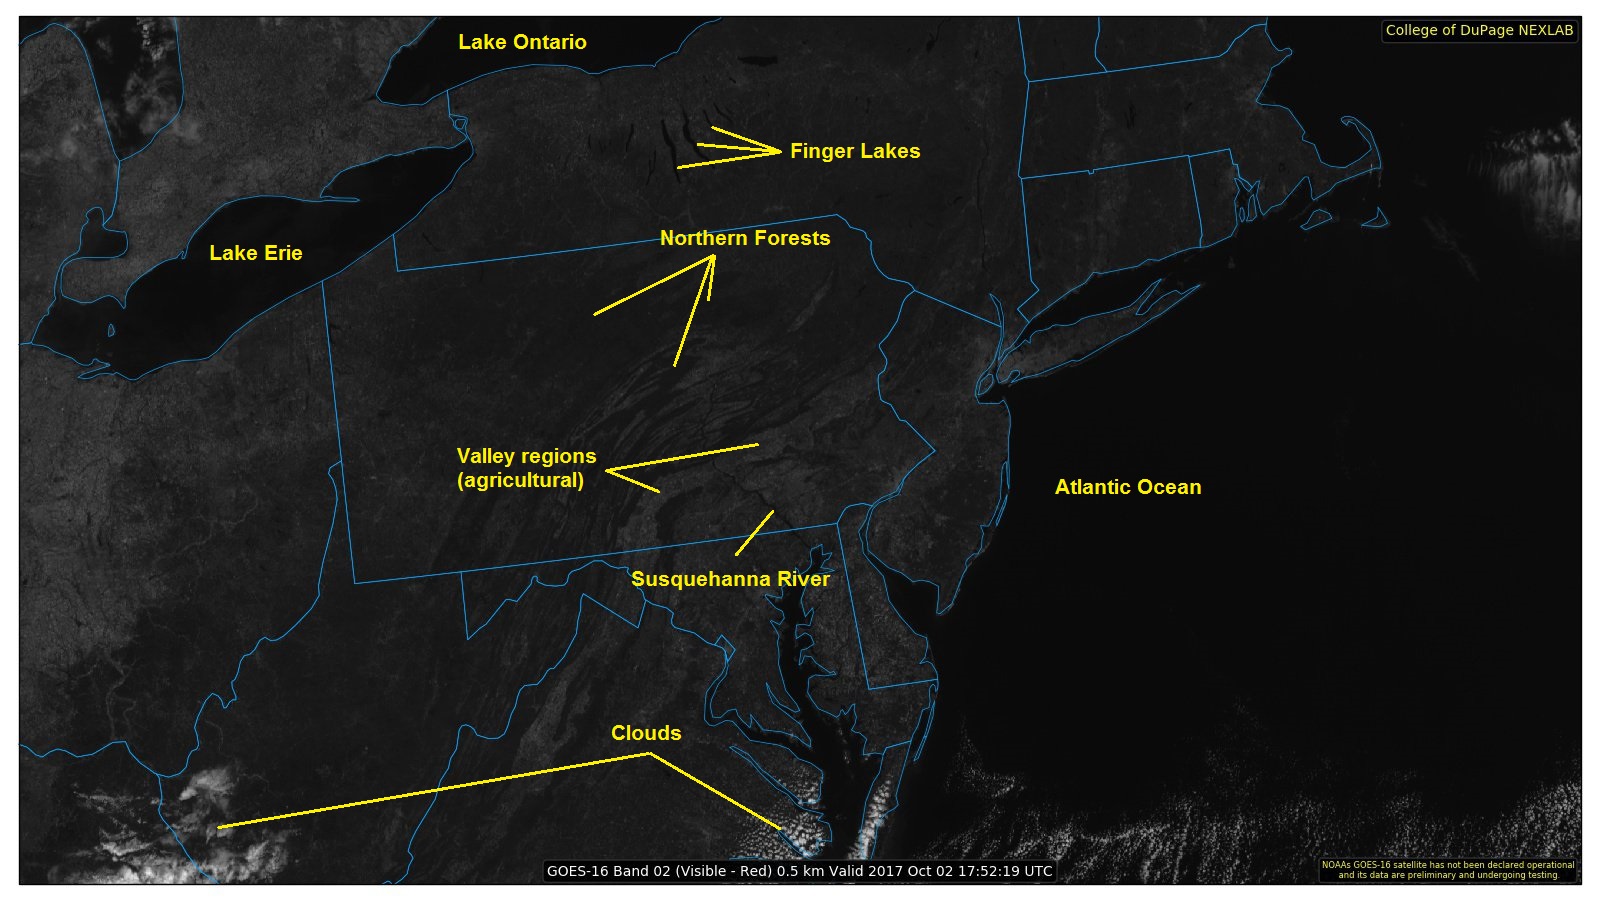
If you want another comparison point, check out the ”true color“ satellite view of Pennsylvania and surrounding states from Google. Can you see how the heavily forested areas of northern Pennsylvania match up with the darker shaded areas I've highlighted above? Can you see how the largely agricultural valleys of southeastern Pennsylvania (with their higher albedo) appear a bit brighter on the image above? Of course, the brightest areas on the visible satellite image above correspond to clouds, which have a much higher albedo than the surface of the earth under most circumstances.
But, many different types of clouds exist, and they all have varying albedos, too! To see what I mean, let's perform an experiment. First, start with a tank of water (upper left in the photograph below). Now add a just tablespoon of milk (upper right), which increases the albedo a bit. By adding the milk, some of the radiation that is passing front-to-back through the tank is being scattered back towards the observer and the water-milk mixture takes on a whitish appearance. In frames #3 and #4 (lower-left and lower-right, respectively), we've added more milk. Now we see that the tiny globules of milk fat further increase albedo as more of the visible light is being scattered back toward the observer, while the transmission of light through the water-milk mixture decreases (that's why the word "SURFACE" is obscured).
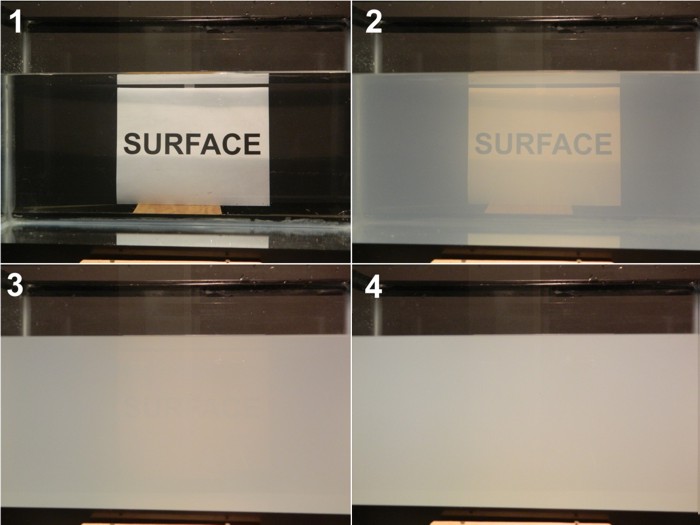
Some key observations that you should note from this experiment:
- It didn't take many globules of milk fat (1 tablespoon of milk in a 10-gallon fish tank) to begin noticeably decreasing transmission and increasing albedo.
- A medium can very quickly become "optically thick" -- that is, nearly zero transmission and a high albedo (a large percentage of light is reflected back to the observer)
- In frame #4, we had only added a total of three tablespoons of milk to the tank (so the tank is still mostly filled with water, yet the transmission of light through the tank is minimal and the albedo is fairly high. Even if we switched to a tank filled with pure milk, the albedo would only increase marginally (maybe another 20 or 30 percent).
This last point is true of clouds as well; once a cloud becomes "thick enough," additional growth will not change its albedo (and appearance on visible satellite imagery) appreciably. The bottom line is that thick clouds, like cumulonimbus (which are associated with showers and thunderstorms), are like tall glasses of milk in the sky; they contain lots of light-scattering water droplets and/or ice crystals. Meteorologists say that such clouds have a "high-water (or ice) content" and can have albedos as high as 90 percent, which causes them to appear bright white on visible satellite imagery.
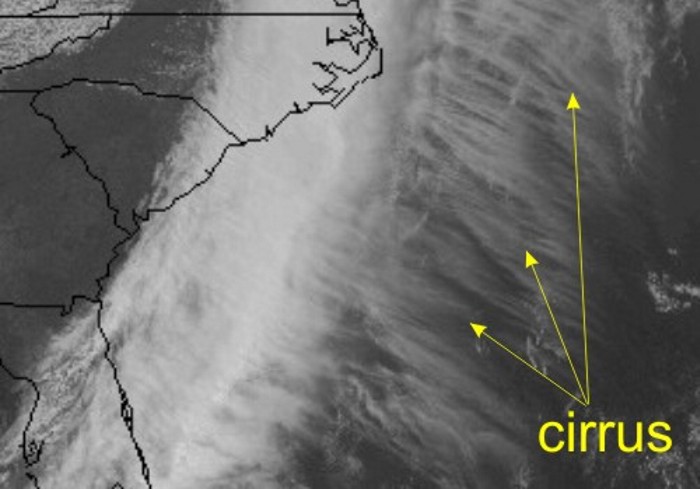
More subdued clouds, such as fog and stratus, typically have a lower water content and a lower albedo (like a glass of water with only a tiny bit of milk). Indeed, the albedo for thin (shallow) fog and stratus can be as low as 40 percent. So, as a general rule, fog and stratus often appear as a duller white compared to thicker, brighter cumulus clouds. Here's an example of valley fog over Pennsylvania and New York on the morning of October 2, 2017, for reference. Wispy, cirrus clouds (high-altitude, thin clouds made of ice crystals) have the lowest albedo (low ice content), averaging about 30 percent. They appear almost grayish compared to the bright white of thick cumulonimbus clouds outlined on the satellite image below.
As a general caveat to our discussion about determining shading on visible satellite images, I point out that brightness also depends on sun angle. For example, the brightness of the visible light reflected back to the satellite near sunset is limited, given the low sun angle and the relatively high position of the satellite. To see what I mean, check out this loop of visible satellite images from the afternoon and evening of March 7, 2017, when severe thunderstorms erupted over Nebraska and Iowa. The tall, thick cumulonimbus clouds that developed appear bright white initially, but as sunset approaches, the appearance of the clouds darkens. If you look closely at the images later in the loop, you'll be able to see tall cumulonimbus clouds casting shadows to the east. Pretty cool, eh?
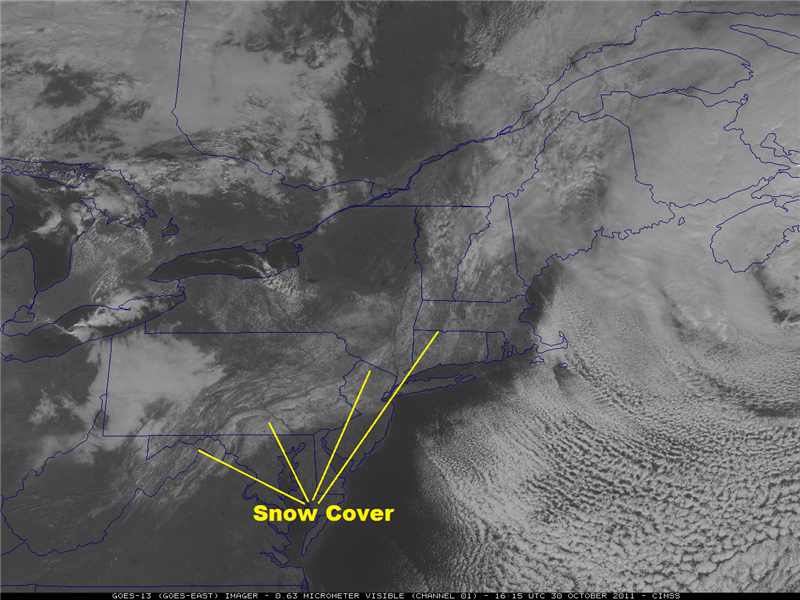
One more quick point about interpreting visible images. Clouds aren't the only objects that can have very high albedos; therefore, they're not the only objects that can appear whitish. Indeed, cloudless, snow-covered regions can have albedos as high as 80 percent, and they also appear bright white on visible imagery. So, how can you tell the difference between clouds and snow cover on standard visible imagery? Two main ways exist:
- Regions of snow covered ground still often reveal details of the local terrain, which appear somewhat darker (unfrozen water lakes and rivers, dense forests which mask the snow pack below, etc.), as in this example from October 30, 2011 in the wake of a big Northeast U.S. snowstorm.
- If you're looking at a loop of visible images, snow cover doesn't move, but clouds do! Here's the corresponding loop of visible images from October 30, 2011. Can you differentiate the stationary snow cover from the moving clouds?
That about wraps up our section on visible satellite imagery. If you're interested in looking at current visible satellite images, NOAA's GOES satellite server, the National Center for Atmospheric Research (NCAR), the College of DuPage, and Penn State all serve as good sources. On those pages, you'll also find other types of satellite imagery, which we're about to cover. But, before you move on, make sure to review the following key points:
Visible satellite imagery...
- is based on the albedo of objects (the fraction of incoming sunlight that is reflected to the satellite).
- can tell you about the thickness of clouds (thicker clouds have higher albedos and appear brighter than thinner clouds, which have lower albedos)
- can be used to distinguish between snow cover and clouds, given that surface features such as lakes and rivers can be observed
- is not able to detect clouds (or anything else) during the satellite's local night (visible imagery requires sunlight).
- is not useful for determining whether precipitation is present under the observed clouds.