Prioritize...
At the completion of this section, you should be able to list and describe the three precipitation factors that affect radar reflectivity, and draw general conclusions about precipitation based on radar reflectivity. You should also be able to discuss why snow tends to be under-measured by radar, and explain the difference between "base reflectivity" and "composite reflectivity."
Read...
Now that you know how a radar works, we need to discuss how to properly interpret the returned radar signal. As with any remote sensing tool, we have to understand what factors influence the amount of radiation that is received by the instrument. As you recall, radar works via transmitted and returned microwave energy. The radar transmits a burst of microwaves and when this energy strikes an object, the energy is scattered in all directions. Some of that scattered energy returns to the radar and this returned energy is then converted to reflectivity (in dBZ). Ultimately, the intensity of the return echo (and therefore, reflectivity) depends on three main factors inside a volume of air probed by the radar "beam":
- the size of the targets
- the number of targets
- the composition of the targets (raindrops, snowflakes, ice pellets, etc.)
Allow me to elaborate a bit on each of these factors impacting radar reflectivity. For starters, the size of the precipitation targets always matters. The larger the targets (raindrops, snowflakes, etc.,) the higher the reflectivity. By way of example, consider that raindrops, by virtue of their larger size, have a much higher radar reflectivity than drizzle drops (the tiny drops of water that appear to be more of a mist than rain). Secondly, the power returning from a sample volume of air with a large number of raindrops is greater than the power returning from an equal sample volume containing fewer raindrops (assuming, of course, that both sample volumes have the same sized drops). The saying that "there's power in numbers" certainly applies to radar imagery!
To see how the size and number of targets impact reflectivity, consider this example. Many thunderstorms often show high reflectivity on radar images, with passionate colors like deep reds marking areas within the storm with a large number of sizable raindrops. A large number of sizable raindrops falling from a cumulonimbus cloud also leads to high rainfall rates at the ground. Thus, high radar reflectivities are usually associated with heavy rain.
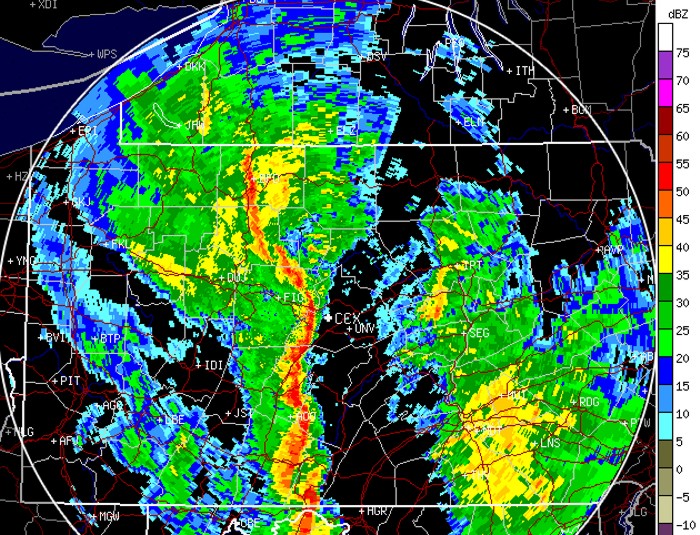
The radar image above from 2255Z on June 1, 2012 shows a line of strong thunderstorms (called a "squall line") just to the west of State College, Pennsylvania (UNV on the map). Although the storm moved through the region very quickly, rainfall rates at the Penn State Weather Center exceeded 0.6 inches in a 10 minute period. This converts to a rainfall rate of 3.6 inches (91.4 mm) per hour! That said, let me caution you that inferring specific rainfall rates from radar images can be tricky business. A given reflectivity can translate to different rainfall rates, depending on, for example, whether there are a lot of small drops versus fewer large drops.
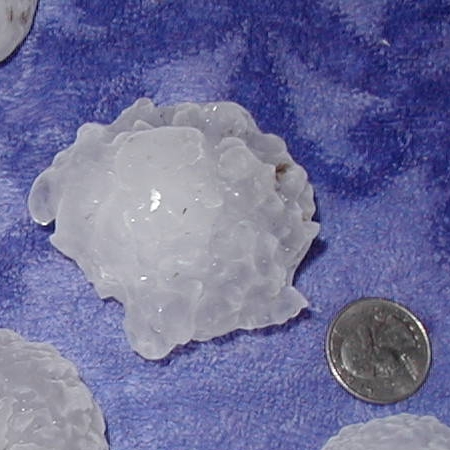
The presence of large hail in thunderstorms can really complicate the issue of inferring rainfall rates from radar reflectivity. Typically, radar reflectivity from a thunderstorm is greatest in the middle levels of the storm because large hailstones have started to melt as they fall earthward into air with temperatures greater than 0 degrees Celsius (the melting point of ice). Covered with a film of melt-water, these large hailstones look like giant raindrops to the radar and can have reflectivity values higher than 70 dBZ. So, when large, "wet hailstones" are present in thunderstorms, rainfall rates inferred from the very large reflectivity are typically overestimated. The bottom line is that higher reflectivity usually corresponds to higher rainfall rates, but the connection is not always neat and tidy.
Okay, lets move on to the final controller of radar reflectivity -- composition. The intensity of the return signal from raindrops is approximately five times greater than the return from snowflakes that have comparable sizes. Snowflakes have inherently low reflectivity compared to raindrops, so it's easy to underestimate the area coverage and intensity of snowstorms if you're unaware of this fact. It might be snowing quite heavily, yet radar reflectivity from the heavy snow might be less than from a nearby area of rain (even if the rainfall isn't as heavy) because the return signal from raindrops is more intense.
Limitations of Radar Reflectivity
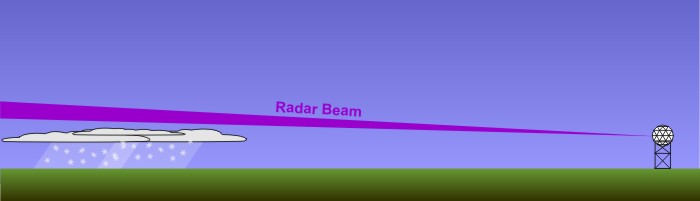
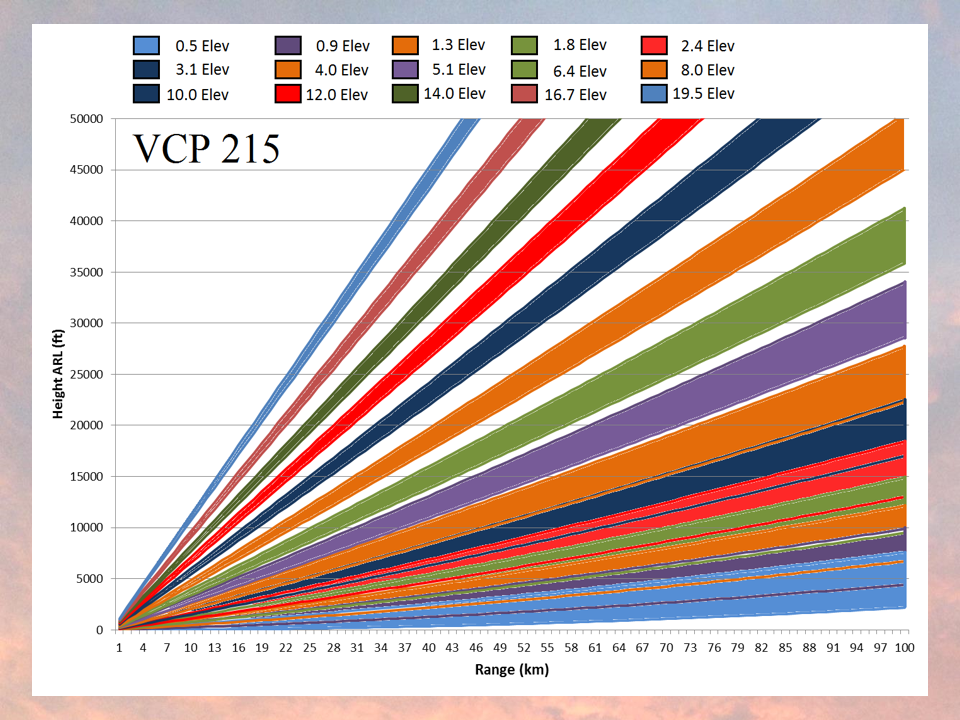
For all of radar's benefits, it has some limitations, too. One big limitation relates to something we covered in the last section -- the increasing elevation of the radar "beam" at increasing distance from the radar transmitter. Indeed, nimbostratus clouds (especially those bearing snow in the winter) are often shallow (not very tall). This fact can cause problems because the radar beam will sometimes overshoot snow-bearing clouds located relatively far away from the radar site (see radar beam on the left, below). When this occurs, snow can fall while the radar shows no reflectivity whatsoever.
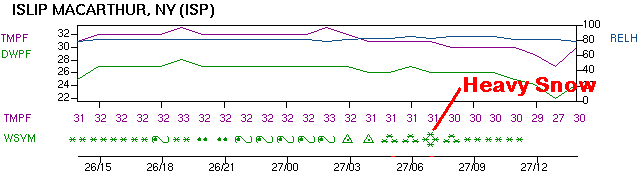
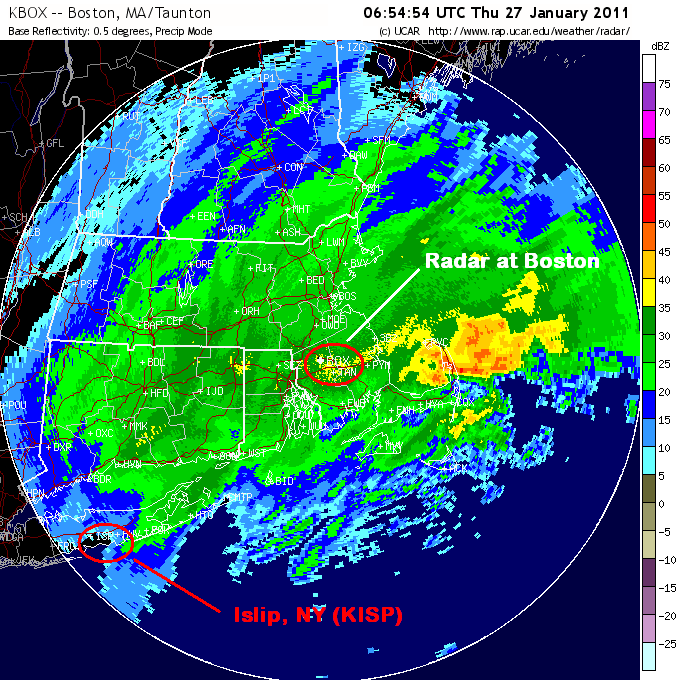
To see what I mean, check out the graph showing weather conditions at Islip, New York (on Long Island), from 14Z on January 26, 2011, to 14Z on January 27, 2011. Note the report of heavy snow at 07Z on the 27th. Now take a look at the 07Z reflectivity from the radar at Boston, and focus your attention on the very weak reflectivity at Islip. Clearly, Islip is almost out of the range of the Boston radar (the white circle), so the radar beam really overshot the relatively shallow nimbostratus clouds producing heavy snow at Islip at the time. Fortunately, the radar at Upton, New York is located closer to Islip, and as you can see its 07Z image of reflectivity, it gives a much more realistic look for Islip. The moral of this story is that you need to be careful interpreting radar images in winter where snow might be falling.
To further complicate interpreting radar images during winter, I point out that partially melted snowflakes present a completely different problem to weather forecasters during winter. When snowflakes melt, they melt at their edges first. With water distributed along the edges of the "arms" of melting flakes, partially melted snowflakes appear like large raindrops to the radar. Thus, partially melted snowflakes have unexpectedly high reflectivity. For pretty much the same reason, wet or melting ice pellets (sleet) also have a relatively high reflectivity. During winter, radar images sometimes show a blob of high reflectivity embedded in an area of generally light rain. Often, this renegade echo of high reflectivity is "wet sleet".
Common Radar Reflectivity Products
The principles I've just described serve as the basis for interpreting most radar reflectivity products that you'll encounter. But, if you regularly watch television weathercasts, or you frequently use an app to look at radar, there's a good chance you've encountered some "enhancements" on basic radar reflectivity. I want to quickly summarize some of these common radar reflectivity products.
Radar Mosaics: While the National Weather Service maintains a network of individual radars covering most of the United States, you've learned that the range of each radar is only 143 miles. That's not very helpful for tracking very large areas of precipitation, so meteorologists often create "radar mosaics," which "stitch together" the reflectivity from the individual radars into a single image covering a larger region (or even the entire country), as shown in the example on the right.
Precipitation-Type Imagery: Commonly, regional or national radar mosaics visually distinguish areas of rain from snow and mixed precipitation (any combination of snow, sleet, freezing rain, and/or rain) using different color keys. Note that rain, mixed precipitation, and snow each has its own color key in this larger version of the radar mosaic above on the right. While the exact methods for creating such images vary, they all start with radar reflectivity, and often incorporate surface temperature and other observations to give a "best guess" of precipitation type. Radars now have some additional capabilities to help discern precipitation type, too, which we'll cover in the next section. Still, keep in mind that such "precipitation-type" radar images aren't perfect (they don't always show the correct precipitation type).
Composite Reflectivity: The radar reflectivity derived from a single radar scan is called "base reflectivity." However, the regional and national radar mosaics that you see on television or online actually show something called composite reflectivity, which represents the highest reflectivity gleaned from all of the radar's scan angles. That's right, radars scan at more than just the 0.5 degree angle we've discussed. NEXRAD units are capable of tilting upward and regularly scanning at angles of elevation as large as 19.5 degrees, which helps forecasters get a feel for the three-dimensional structure of precipitation. For example, if a powerful thunderstorm erupts fairly close to the radar, a scan at the shallowest angle of 0.5 degrees would likely intercept the storm below the level where the most intense reflectivity occurs. Such a single, shallow scan falls way short of painting a proper picture of the storm's potential. As a routine counter-measure, the radar tilts upward at increasingly large angles of elevation, scanning the entire thunderstorm like a diagnostic, full-body MRI.
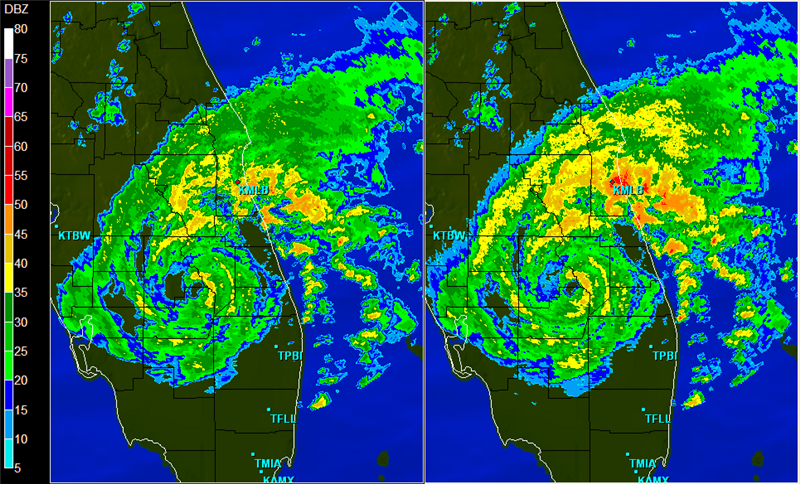
So, a radar image created from composite reflectivity will likely display a higher dBZ level (more intense colors) than a radar image of base reflectivity. For example, on August 19, 2008, Tropical Storm Fay was moving very, very slowly over the Florida peninsula. The 1938Z base reflectivity (on the left, above) shows fairly high dBZ values (orange) in the immediate vicinity of the radar site at Melbourne, FL (KMLB). At the time, heavy thunderstorms were pounding the east-central coast of Florida. Now shift your attention to the image of composite reflectivity on the right (above). Notice the reddish colors near Melbourne, which indicate higher dBZ values (compared to the corresponding radar echoes on the image of base reflectivity). Composite reflectivity may not be representative of current precipitation rates at the ground, but it can show the potential if the precipitation causing the highest reflectivity (often well up into the cloud) can fall to the surface.
Now that you know how to interpret radar reflectivity, we're going to look at some additional capabilities of NEXRAD, which allow weather forecasters to infer wind velocities and and better detect severe weather like hail and tornadoes. Read on.