Prioritize...
Upon completion of this page, you should be able to discuss the Doppler effect, its use in radar data collection, and the benefits of Doppler radar data. You should also be able to discuss what is meant by dual polarization radar and discuss its advantages.
Read...
Modern radars are capable of much more than just measuring reflectivity. As I mentioned briefly before, the generation of radars known as NEXRAD, which have been in operation since 1988, also are "Doppler" radars. Those radars have since been upgraded to include "dual polarization" capabilities, which provide meteorologists with a variety of other useful information. While we won't cover the details of Doppler radar or dual polarization in depth, I do want you to have a basic understanding of how they work and what they're useful for.
Doppler Radar

Johann Christian Doppler was an Austrian mathematician who applied his expertise to astronomy. In 1842, he wrote a landmark paper, in which he explained that an observer's perception of the change in the frequency of starlight was a result of the relative motion between the observer and the star (or stars).
Doppler broadened the scope of his hypothesis to include sound, suggesting that the pitch of a sound (frequency of the sound waves) would change when the source of the sound was moving. He tested his hypothesis in 1845, when he employed two groups of trumpeters to participate in an experiment: One group rode in an open, moving train car while the other group prepared to play at a train station. He instructed both groups of musicians to hold the same note (we assume that they all had perfect pitch). As the train passed the station, there was a noticeable difference in the frequency of the notes -- essentially proving Doppler's hypothesis. The change in frequency of a wave when either the source or an observer moves became known as the Doppler effect, and Doppler's work paved the way for the modern network of NEXRAD Doppler radars.
You may be most familiar with the Doppler effect as it relates to moving automobiles or trains. For example, check out this short video of a driver sounding the horn on a minivan traveling 45-50 miles per hour past a stationary camera. Listen to the change in the horn's pitch as the minivan moves toward the camera and then away from the camera. It is important that you do not liken the change in pitch (a change in the frequency of sound waves) to a change in loudness, which is how most people erroneously perceive the Doppler effect.
The Doppler effect also applies to pulses of microwaves transmitted by radars. Baseball scouts rely on the Doppler effect when they point radar guns at the fastballs hurled by prospective pitchers. The change in frequency of the returning signal after it bounces off a thrown baseball is quickly translated into a velocity. Radar guns used by police to catch speeders operate in the same way. In a nutshell, the frequency of microwaves back-scattered from a radar target changes if the target is moving.
In terms of radar, microwaves back-scattering off raindrops moving toward the radar return at a higher frequency, and the faster the speed of the raindrops, the higher the frequency of the reflecting microwaves. Conversely, microwaves back-scattering off raindrops that are moving away from the radar return at a lower frequency. Changes in frequencies are then translated, by computer, into velocities, which are sometimes simply called "Doppler velocities." I should note, however, that Doppler radars can only "see" two directions of motion -- toward the radar (inbound) and away from the radar (outbound).
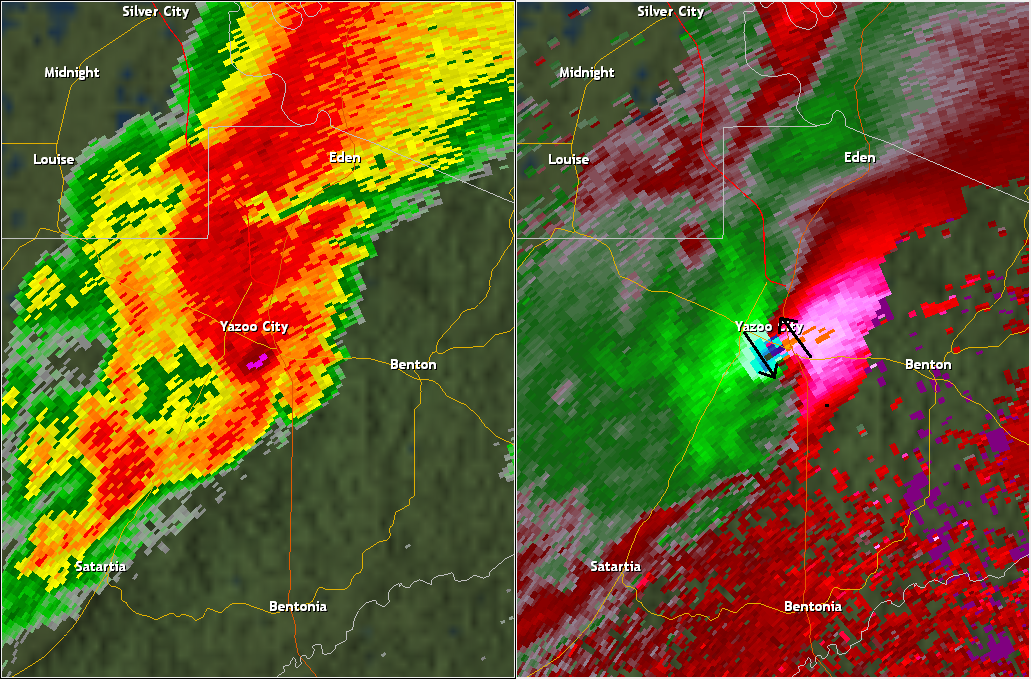
So, what is Doppler velocity data useful for? One major benefit of this data is that it can help forecasters detect areas of rotation within thunderstorms, which can be precursors to tornado formation. When forecasters spot strong outbound velocities (conventionally depicted by reds and pinks) adjacent to areas of inbound velocities (conventionally depicted by greens and blues), as shown on the image of Doppler velocities on the right below, the apparent rotation definitely catches their attention! If you imagine a pinwheel located between the two arrows I've drawn, do you see how it would rotate? In this particular case, a violent tornado was tracking near Yazoo City, Mississippi at the time of these corresponding reflectivity and Doppler velocity images. Fortunately, thanks in part to Doppler velocities, forecasters had issued a tornado warning roughly a half hour before the tornado struck Yazoo City. Still, 10 people died, but it would likely have been much worse without the advanced warning made possible by Doppler radar.
In addition to helping forecasters detect storms that may produce tornadoes, Doppler radar can also help forecasters measure wind speeds above the surface (remember the radar "beam" increases in elevation at greater distances from the radar), which can help forecasters assess the potential for damaging wind gusts, even in non-tornadic thunderstorms. So, there's no doubt that Doppler radar is an invaluable public-safety asset, but radar coverage in the U.S. is not perfect. Because the radar "beam" rises in elevation at greater distances, some areas of the U.S. are not adequately covered with the low-altitude radar scans that are ideal for severe weather forecasting. If you're interested in reading more about this topic, I suggest this article from the Capital Weather Gang in The Washington Post from 2015.
Dual Polarization Radar
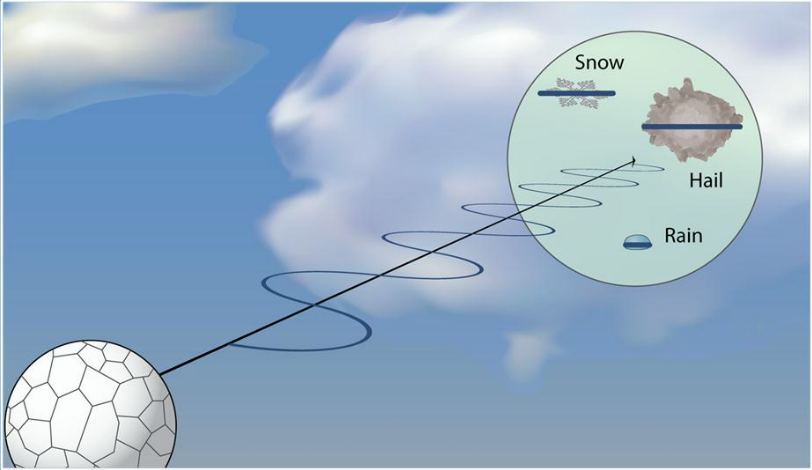
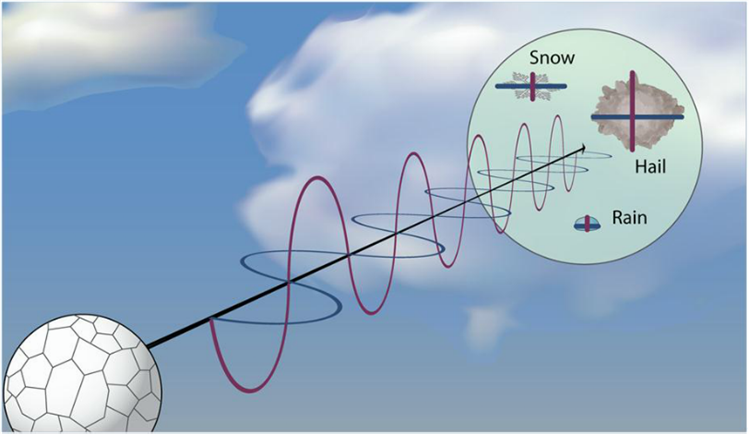
Historically, radars (even NEXRAD Doppler radars) sent out pulses of microwave radiation that traveled in the horizontal dimension. But, in early 2012, the National Weather Service began to upgrade its fleet of radars with dual polarization capability ("dual pol," for short). A dual-polarized radar transmits (and eventually detects) pulses of microwave energy in both horizontal and vertical dimensions (see the idealized schematic below). In this way, the radar provides information about the horizontal and vertical configuration of targets that scatter radar-transmitted microwave energy back to the radar. In other words, dual polarization gives meteorologists a better sense for the size and shape of the atmospheric targets detected by the radar.
With the additional information about the size and shape of targets, the bottom line is that dual-pol radars can:
- alert forecasters that there's more than one type of precipitation present within the range of the radar
- identify airborne debris from tornadoes (pieces of insulation and shingles, for example), and
- differentiate between precipitation targets (rain, snow, hail, etc.) and "biological targets" (birds, insects, etc.)
Dual pol radar gives forecasters several additional products to look at, but I'll spare you the details (they're beyond the scope of this course). Still, I want to give you an idea of the value of dual pol data, using one of the additional products that dual pol provides, called "correlation coefficient."
In short, "correlation coefficient" helps forecasters identify whether an area as a large or small variety of radar targets and can help forecasters discern whether an area has "meteorological" targets (rain, snow, hail, etc.) or "non-meteorological" ones, like flying debris in a tornado. The ability to better identify airborne debris can give weather forecasters additional confirmation that a tornado is actually occurring (with Doppler velocity data alone, we usually can't be sure).
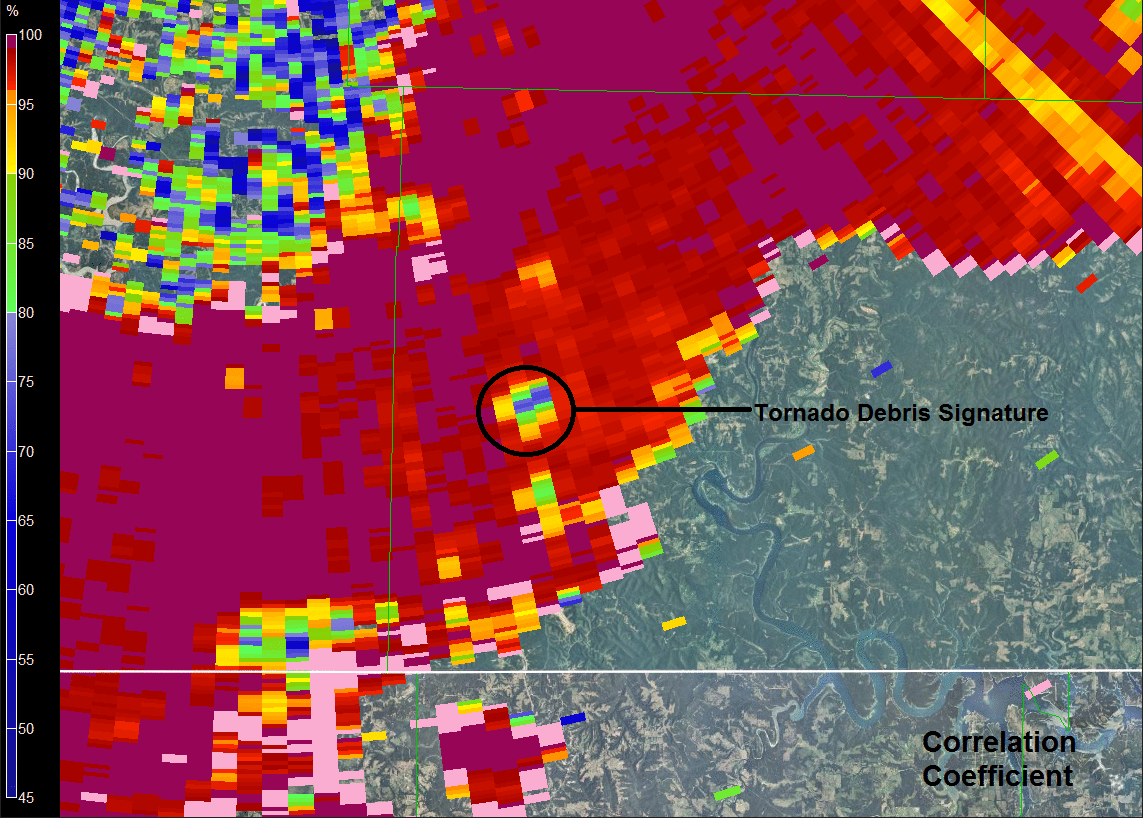
To see what I mean, check out this animation showing the simultaneous images of base reflectivity, Doppler velocities, and correlation coefficient from February 29, 2012 in Missouri. Focus near the center of the image, where there's an area of rotation on the Doppler velocity image (outbound velocities in red, adjacent to inbound velocities in green). On the image of correlation coefficients, the corresponding area has low values (the circled blob of blue and green), which marked a "tornado debris signature." The low values of correlation coefficient in that area signaled that the dual pol transmission had encountered irregularly shaped debris flying through the air. I should note, however, that forecasters must use dual pol data in conjunction with reflectivity and Doppler velocity data to identify tornado debris signatures. The key to identifying this as a tornado debris signature was that the blob of low correlation-coefficient values was co-located with a strong area of rotation in the storm.
I'm just scratching the surface, but in addition to better identifying airborne debris from tornadoes, dual pol data also helps forecasters distinguish between raindrops, snowflakes, and hailstones, which helps improve the accuracy of “precipitation type” radar reflectivity images, and improves the radar's ability to estimate rainfall rates and totals. So, there's no doubt that dual pol radar is becoming an increasingly important tool for weather forecasters!
Up next, we'll wrap up our lesson with a brief summary of the remote sensing tools that we've covered in this lesson.