Prioritize...
After reading this section, you should be able to describe how a radar works and what portion of the electromagnetic spectrum that modern radars use. You should also be able to define the term "reflectivity" as well as its units. Furthermore, you should be able to explain how a radar locates a particular signal and describe concepts such as beam elevation and ground clutter.
Read...
I'd guess that most folks have seen weather radar imagery before, either on television, on the Web, or on your favorite weather app. Radar imagery is perhaps the remote sensing product that's most commonly consumed by the public. Radar imagery has been helping weather forecasters detect precipitation since World War II, but the roots of modern radar can be traced all the way back to the late 1800s and German physicist Heinrich Hertz's work on radio waves. While early radars used radio waves (radar is actually an acronym for RAdio Detection And Ranging), the United States, in a joint effort with Great Britain, advanced the design of radar by using microwaves, which have shorter wavelengths than radio waves as you may recall from our discussions on the electromagnetic spectrum.
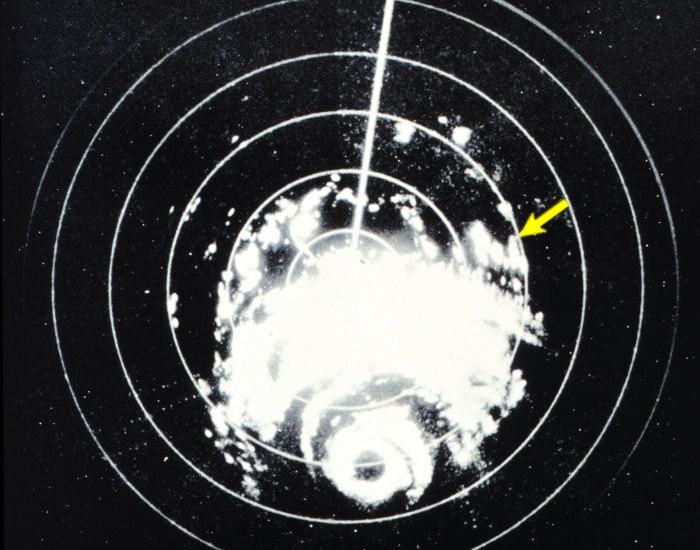
The shift to shorter wavelengths provided more precision in detecting and locating objects relative to the microwave transmitter, and in World War II radar was to detect enemy aircraft, as well as squadrons of airborne raindrops, ice pellets, hailstones, and snowflakes. Ultimately, the World War II radars served as the prototypes for the WSR-57 radars that were used by the National Weather Service for decades (WSR stands for "Weather Surveillance Radar" and the "57" refers to 1957, the first year they became operational). This image, taken from a WSR-57 radar, which looks rather crude by modern standards, shows the pattern of precipitation in Hurricane Carla near the Texas Coast on September 10, 1961. The yellow arrow in the north-east quadrant of the storm points to the location where a tornado (a rapidly rotating column of air extending from the base of a cloud all the way to the ground) occurred near Kaplan, Louisiana.
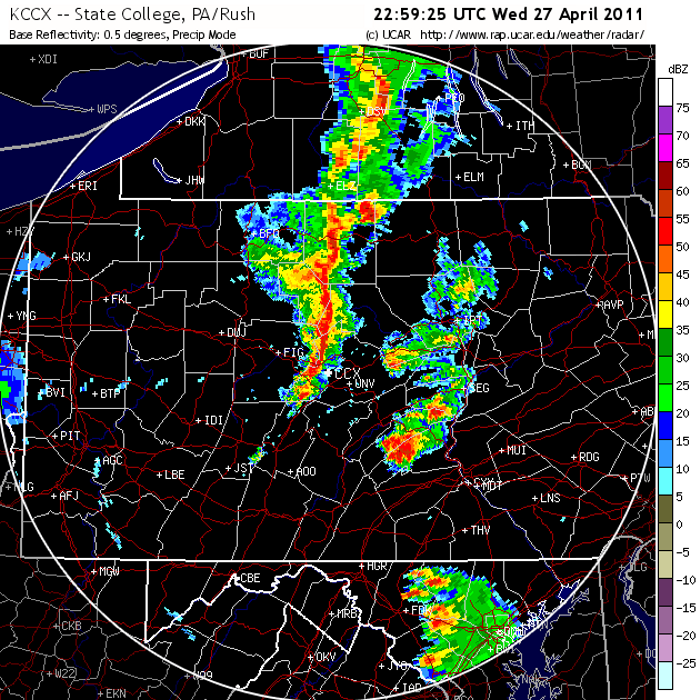
The next generation of radars, appropriately tagged with the acronym, NEXRAD for NEXt Generation RADars, became operational in 1988. Weather forecasters often refer to one of these radars as a WSR-88D. The "WSR" is short for "Weather Surveillance Radar," the "88" refers to the year this type of radar became operational and the "D" stands for "Doppler," indicating the radar's capability of sensing horizontal wind speed and direction relative to the radar (we'll talk more about this later). Check out the sample image (below) from the WSR-88D radar at State College, PA, at 23Z on April 27, 2011.
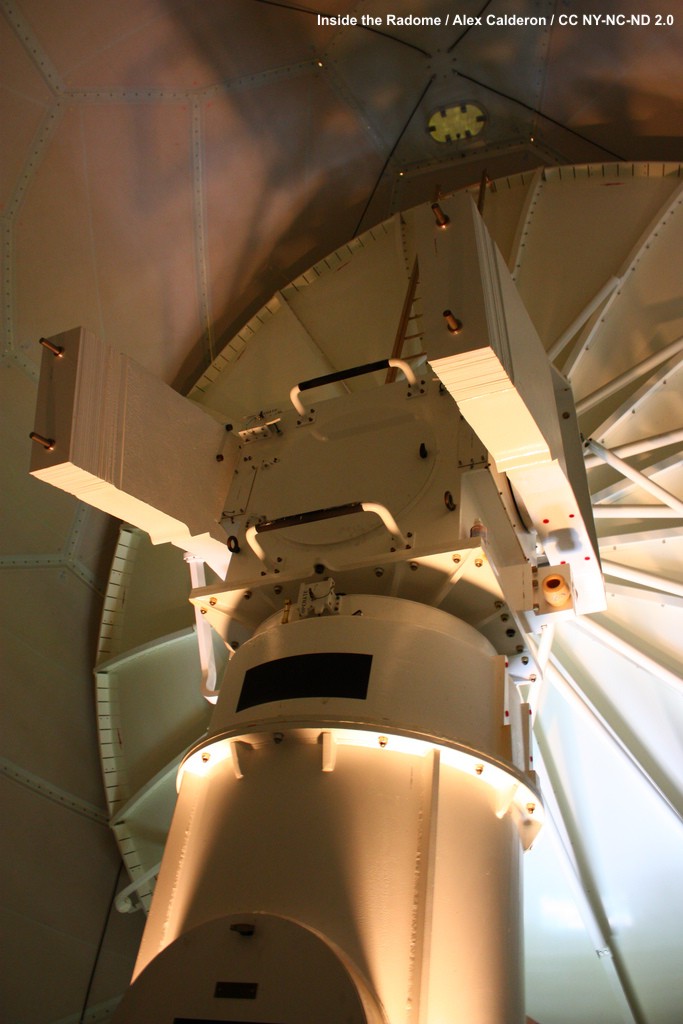
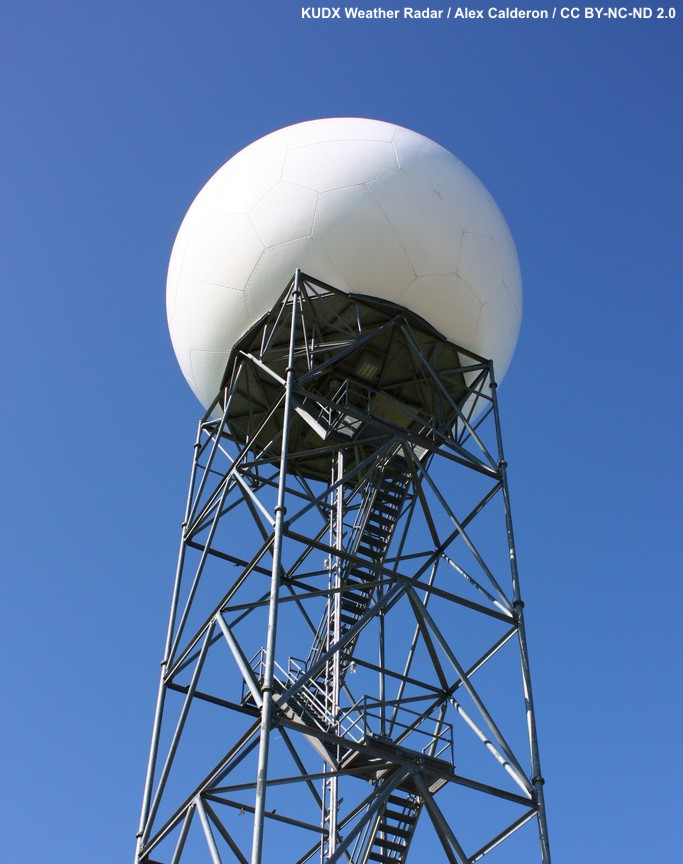
So, ultimately, how do radars work? Well, for starters, radar is an active remote sensor, unlike the satellite-based sensors we've just covered. While radiometers sit aboard satellites orbiting in space and passively accept the radiation that comes their way from Earth and the atmosphere, the antenna of a WSR-88D, housed inside a dome, transmits pulses of microwaves at wavelengths near 10 centimeters. Once the radar transmits a pulse of microwaves, any airborne particle lying within the path of the transmitted microwaves (such as bugs, birds, raindrops, hailstones, snowflakes, ice pellets, etc.) scatters microwaves in all directions. Some of this microwave radiation is back-scattered or "reflected" back to the antenna, which "listens" for "echoes" of microwaves returning from airborne targets (see the animation below).
The radar's routine of transmitting a pulse of microwaves, listening for an echo, and then transmitting the next pulse happens faster than a blink of an eye. Indeed, the radar transmits and listens at least a 1000 times each second. But, like a friend who's a good listener, the radar spends most of its time listening for echoes of returning microwave energy. The radar's antenna has to have a really "good ear" for listening because only a tiny fraction of the power that's emitted by the radar actually gets scattered back. Indeed, the pulse emitted by the radar has about 100 million times more power than the return signal. It turns out that it's easiest for meteorologists to convert these weak radar return signals to an alternative measure of echo intensity called reflectivity with units of dBZ (which stands for "decibels of Z"), which is a logarithmic measure of reflectivity. Don't worry about the details of "logarithmic" measure; the bottom line is that the value of dBZ increases as the strength (power) of the signal returning to the radar increases.
To pinpoint the position of an echo relative to the radar site (within the circular range of the radar), the target's linear distance and compass bearing from the radar must be determined. First, realize that the transmitted and returning signals travel at the speed of light, so by measuring the time of the "round trip" of the radar signal (from the time of transmission to the time it returns), the distance that a given target lies from the radar can be determined. For example, it takes less than two milliseconds for microwaves to race out a distance of 230 kilometers (143 miles) and zip back to the radar antenna (143 miles represents the maximum range of radars operated by the National Weather Service).
How does the radar know the direction or bearing of the target relative to the radar? Well, in order to "see" in all directions, the radar antenna rotates a full 360 degrees at a speed usually varying from 10 degrees to as much as 70 degrees per second. A computer keeps track of the direction that the antenna is pointing at all times, so when a signal is received, the computer calculates the reflectivity, figures out the angle and distance from the radar site, and plots a data point at the proper location on the map. Believe it or not, all of this happens in just a fraction of second!
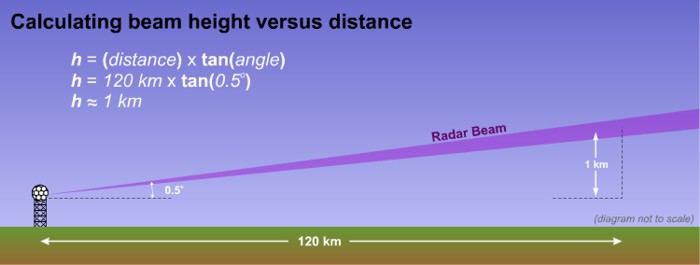
I need to mention, however, that the radar typically does not transmit its signal parallel to the ground. Indeed, the standard angle of elevation is just 0.5 degrees above a horizontal line through the radar's antenna (see the schematic below); however, some NEXRAD units can scan at even smaller angles of elevation if local terrain allows. Either way, the radar "beam" is initially not much higher above the ground than the radar itself, but with increasing distance from the radar, the "beam" gets progressively higher above the ground (and its width increases). At a 0.5 degree scanning angle and a distance of 120 kilometers (about 75 miles) from the radar transmitter, the radar "beam" is more than 1 kilometer above the surface (nearly 3,300 feet). Near the maximum range of 230 kilometers, the radar beam is at twice that altitude.
Don't worry about the specifics of calculating specific "beam" heights, but I do want to make you aware of several implications of the increasing elevation of the radar scan. First, you should realize that radar imagery often shows reflectivity from the precipitation targets within a cloud, and not necessarily what is falling out of the cloud. If you don't realize this fact, you can sometimes get confused when looking at radar imagery. For example, often when light precipitation falls into a layer of dry air below, it evaporates entirely before reaching the ground. Yet, it may look like it's precipitating on a radar image because the radar "sees" the precipitation at the level of the cloud.
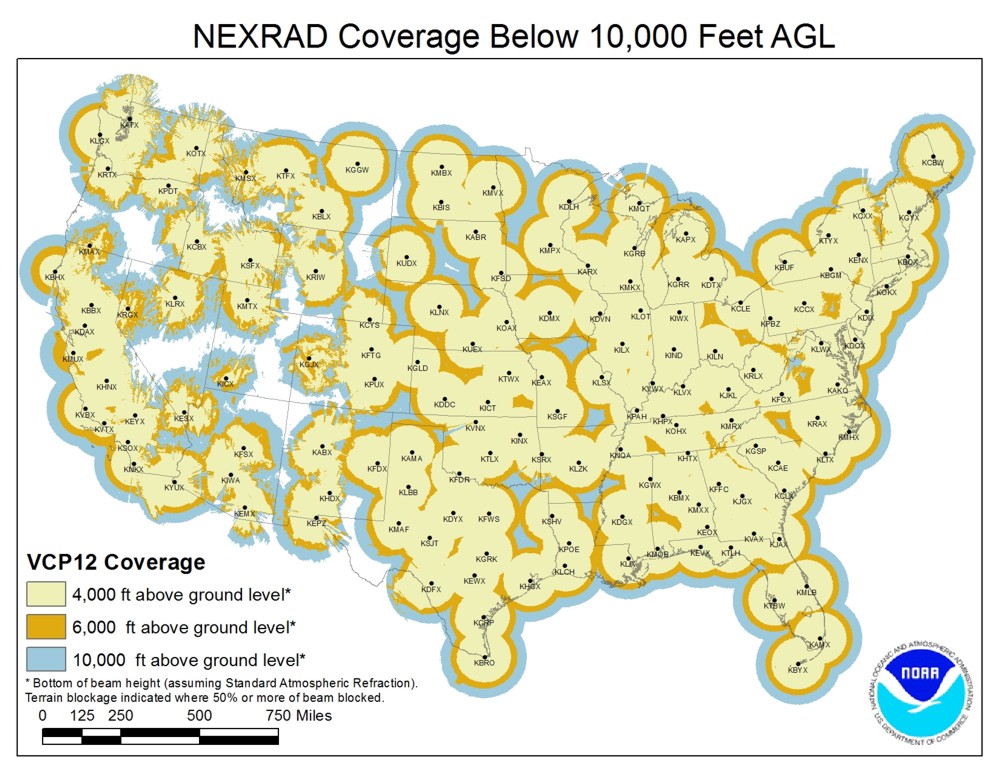
Secondly, you should realize that radar signals are not typically obstructed by geography at distances more than, say, 25 miles from the radar (the "beam" is more than 1,100 feet off the ground at that point). The only exception to this rule is that there are certain locations, particularly in the western United States, where tall mountains can block portions of the radar "beam." Check out this image showing the coverage of NEXRAD radars for the U.S. Note how some of the "circles of echoes" in the West look like somebody took a bite out of them. The irregular radar coverage over the western U.S. is a direct result of the mountainous terrain blocking some of the radar "beams."
At most sites, however, less than 25 miles from the radar site, a collection of stationary targets called "ground clutter," including buildings, hills, mountains, etc., frequently intercepts and back-scatters microwaves to the radar. Computers routinely filter out the common ground clutter so that radar images don't lend the impression that precipitation is always falling near the radar site.
So, now that you know how radar works, what determines the strength of the returning radar signal? And, how do you interpret the rainbow of colors on radar images? We'll cover these questions in the next section. Before continuing, however, please review these key facts about radar imagery.
Radar imagery...
- originates from ground-based sensors (not from satellites) that actively emit pulses of radiation.
- uses the microwave part of the electromagnetic spectrum (not the infrared).
- usually displays the variable "reflectivity" (units dBZ) which is the measure of the amount of signal returned to the radar from the original transmitted pulse.
- can help forecasters identify areas of precipitation.
- cannot tell you anything about cloud top temperature, cloud height, or cloud thickness.