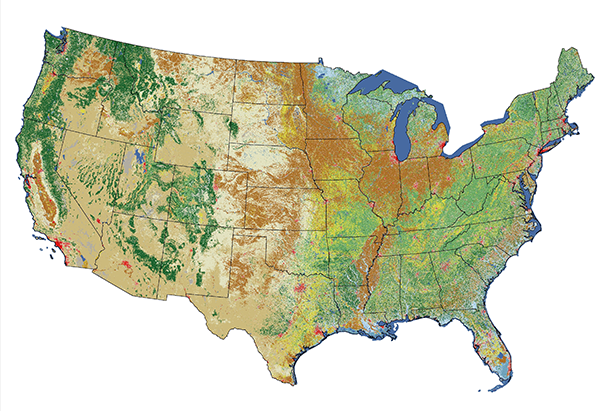
The USGS has used remotely sensed imagery to map land use and land cover since the 1970s. Analysts compiled the first Land Use and Land Cover dataset (LULC) by manual interpretation of aerial photographs acquired in the 1970s and 80s. The successor to LULC was the National Land Cover Dataset (NLCD), which USGS created from Landsat imagery in 1992, 2001, 2006, and 2011 at a spatial resolution of 30 meters. The following case study outlines the evolving workflow used to produce the NLCD, including a change in image classification approaches between the 1992 NLCD and later versions.
Preprocessing
The primary source data used to create NLCD 92 were the visible red, near-infrared, mid-infrared, and thermal infrared bands of cloud-free, leaf-off Landsat TM scenes acquired in 1992. In comparison, source data used for NLCD 2001 and later versions were more diverse. NLCD 2001 sources included "18 or more layers" of "multi-season Landsat 5 and Landsat 7 imagery ... and Digital Elevation Model derivatives" (Homer and others, 2007; USGS 2014). In 1992 as well as subsequent versions, selected scenes were geometrically and radiometrically corrected, then combined into sub-regional mosaics. Mosaics were then projected to the same Albers Conic Equal Area projection based upon the NAD83 horizontal datum, and then were resampled to 30-meter grid cells.
Image classification
From the outset, the LULC and NLCD datasets have used variations on the Anderson Land Use/Land Cover Classification system. The number and definitions of land use and land cover categories have evolved over the years since their original 1976 publication.
For NLCD 92, analysts applied an unsupervised classification algorithm to the preprocessed mosaics to generate 100 spectrally distinct pixel clusters. Using aerial photographs and other references, they then assigned each cluster to one of the classes in a modified version of the Anderson classification scheme. Considerable interpretation was required since not all functional classes have unique spectral response patterns.
From NLCD 2001 on, the USGS project team used "decision tree" (DT), "a supervised classification method that relies on large amounts of training data, which was initially collected from a variety of sources including high-resolution orthophotography, local datasets, field-collected points, and Forest Inventory Analysis data" (Homer and others, 2007). The training data were used to map all classes except the four urban classes, which were derived from an imperviousness data layer. A series of DT iterations was followed by localized modeling and hand editing.
For more information about the National Land Cover Datasets, visit the Multi-Resolution Land Characteristics Consortium
Accuracy Assessment
As you'd expect, the classification accuracy of NLCD data products has improved over the years.
The USGS hired private sector vendors to assess the classification accuracy of the NLCD 92 by checking randomly sampled pixels against manually interpreted aerial photographs. Results indicated that the likelihood that a given pixel was classified correctly was only 38 to 62 percent. USGS therefore encouraged NLCD 92 users to aggregate the data into 3 x 3 or 5 x 5-pixel blocks (in other words, to decrease spatial resolution from 30 meters to 90 or 150 meters), or to aggregate the (then) 21 Level II Anderson classes into the nine Level I classes.
A similar assessment of NLCD 2006 demonstrated that accuracy had indeed improved. Wickham and others (2013) found that overall accuracies for the NLCD 2001 and 2006 Level II Anderson class were 79% and 78%, respectively.
If that still doesn't seem very good, you'll appreciate why image processing scientists and software engineers are so motivated to perfect object-based image analysis techniques that promise greater accuracies. Even in the current era of high-resolution satellite imaging and sophisticated image processing techniques, there is still no cheap and easy way to produce detailed, accurate geographic data.